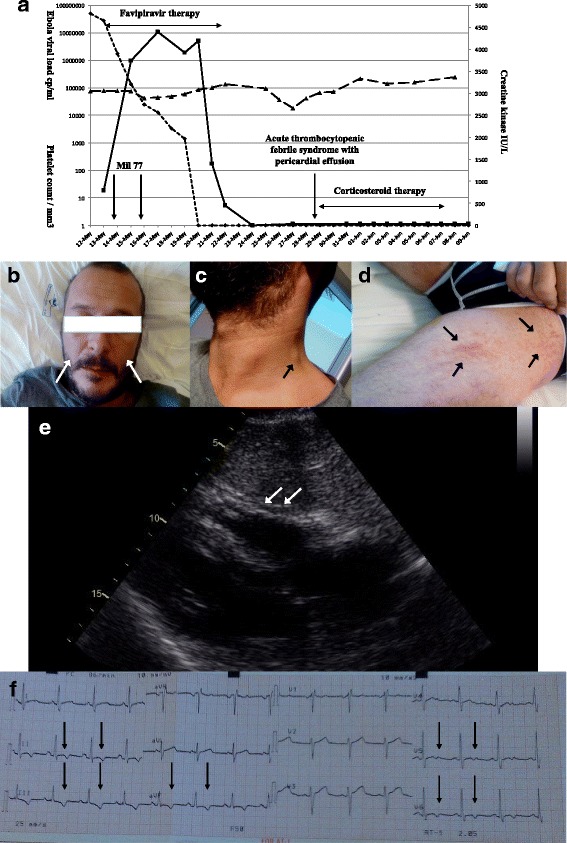
Fig. 1.

Ebola plasma viral load, creatine kinase levels, platelet count, timing of drug administration and of occurrence of the thrombocytopenic febrile syndrome (panel a); Skin lesions on the face and on the left thigh, and neck adenopathy (panels b-d); Echocardiographic evidence of MILD circumferential pericardial effusion at the time of the thrombocytopenic febrile syndrome and ECG showing ECG showed diffuse nonspecific abnormalities (panels e and f). Legend of panel A: The Y-axis indicates Ebola viral load (copies/ml) and platelet count (platelet/mm3). The Z-axis indicates creatine kinase levels (International Units/Liter). CK creatine kinase
