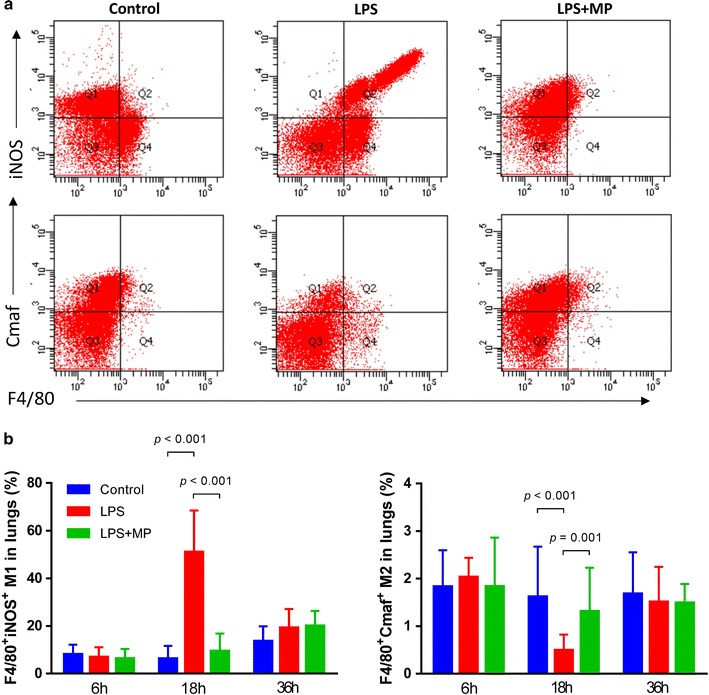
Fig. 4.

Macrophage subsets in vivo. After separating single cell in lung, flow cytometry was performed. a The percentage of F4/80+iNOS+ M1 and F4/80+Cmaf+ M2 were detected by flow cytometry of in the lung. b Semi-quantitative analysis showed F4/80+Cmaf+ M2 was decreased in the LPS group. MP treatment reduced M1 and increased M2 in the lung. No difference was observed between the control and MP treatment groups at 6 and 36 h. Data were shown as mean ± S.D.; n = 5 mice per group
