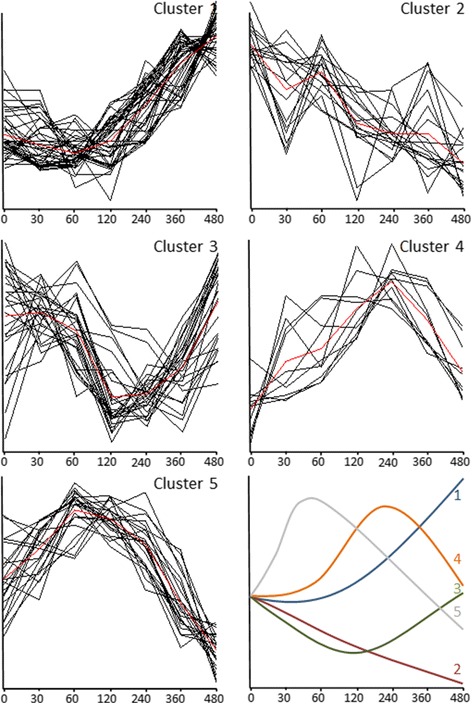
Fig. 3.

The five different observed time course clusters in response to the PhenFlex test, based on the 110 plasma metabolites and proteins with a significant effect in time. The red line represents the average cluster time profile. The x-axes were expressed as time (minutes), the y-axes were expressed as relatively scaled concentrations. Parameters from cluster 1 increased during most of the 8-h time course. Parameters from cluster 2 decreased during most of the time course of 8 h. Parameters from clusters 3 decreased upon PFT, with a subsequent recovery phase. Parameters from cluster 4 showed a classical absorption profile. Parameters from cluster 5 reached maximum values around 1 h and minimum concentrations were reached at the final time point (8 h). Finally, the different average cluster curves are summarized in one figure
