
Fig. 5.
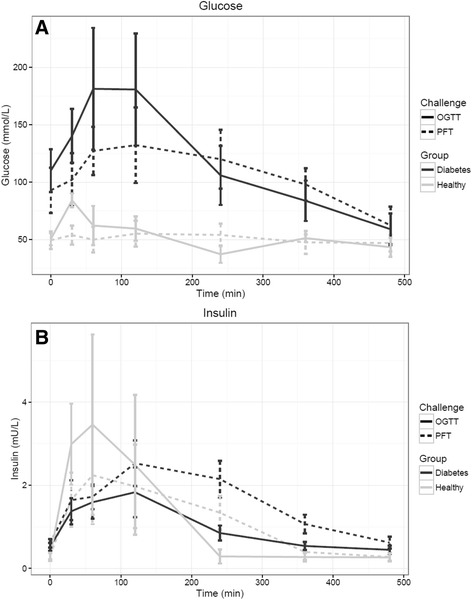
a Average glucose response in OGTT vs PhenFlex test in 20 diabetic type 2 male patients and 20 healthy male volunteers. b Average insulin response in OGTT vs. PhenFlex test in 20 diabetic type 2 male patients and 20 healthy male volunteers. Red = average diabetes type 2 response. Blue = average healthy response. Solid line = PhenFlex test. Broken line = OGTT