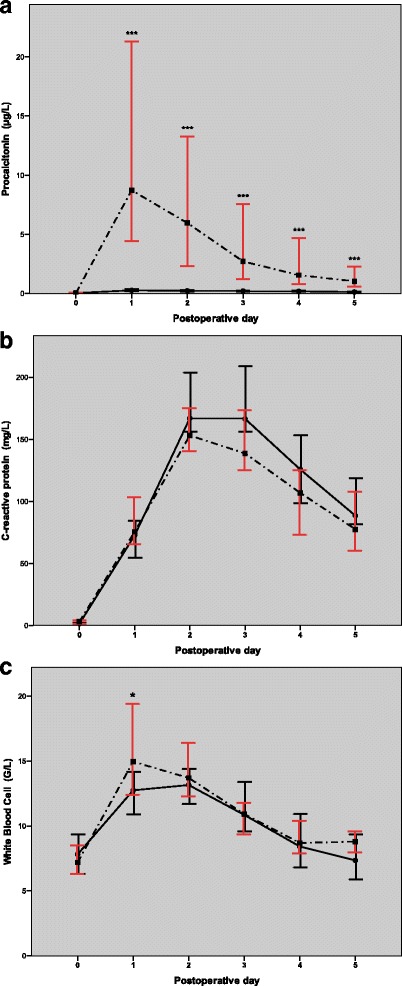
Fig. 1.

Changes in the procalcitonin (a), C-reactive protein (b) and white blood cell count (c) levels during the postoperative period. A continuous line demonstrates low inflammatory response (LIR) and a dotted line shows the high inflammatory response (HIR) group. Spots and error bars represent the medians and 95% confidence intervals. Significant differences between the LIR and HIR groups are demonstrated with asterisks: *** p < 0.001, Mann-Whitney U test
