
Fig. 6.
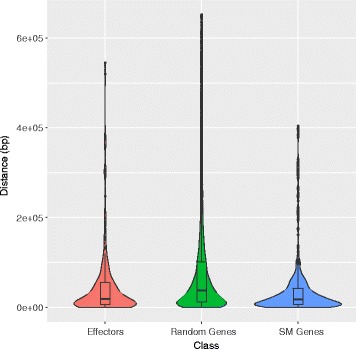
Violin plot depicting the frequency distribution of the distance (bp) between genes and the nearest transposable element (TE). The inner box plots represent the median and interquartile range of the distance for each of three gene classes. Genes located within secondary metabolism clusters (SM genes) and genes encoding candidate secreted effector proteins were located significantly closer (p < 0.001) to TEs than a random sample of genes taken from the genome as a whole