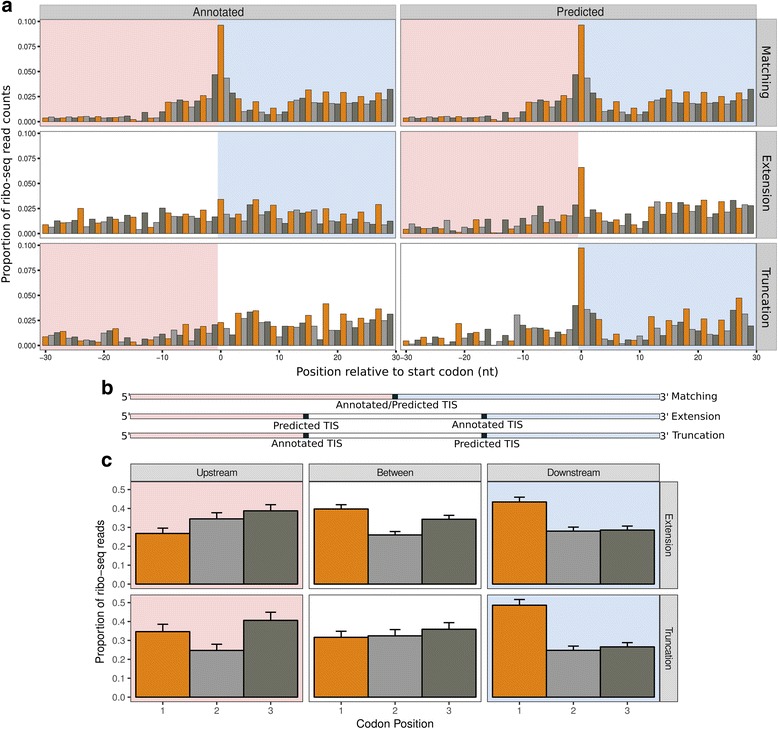
Fig. 3.

Ribo-seq reads and periodicity are consistent with re-annotated translation initiation sites. Bar colour indicates codon position. Downstream regions are highlighted in pink, upstream regions are highlighted in light blue. a Meta-plots showing the proportion of scaled ribo-seq reads, after read length-specific adjustment, in relation to annotated or predicted translation initiation sites, for open reading frames matching annotated genes (n = 3853), predicted extensions (n = 214) or predicted truncations (n = 205). Contributions from each gene are scaled to a sum of one. Annotated translation initiation sites (TISs) show statistically significant increases in ribo-seq density upstream (extensions, Wilcoxon rank sum test W = 252,580, P = 2.156 × 10⁻⁶), or downstream of start codons (truncations, Wilcoxon rank sum test W = 293,200, P = 1.139 × 10⁻⁵). b Transcript models. c Bar plots with standard error of the mean, showing the proportion of scaled ribo-seq read counts, after read length-specific adjustment, in each codon position. For truncations, regions are 30 nt upstream of the annotated TIS, between the annotated and predicted TIS, and 30 nt downstream of the predicted TIS. For extensions, regions are 30 nt upstream of the predicted TIS, between the predicted and annotated TIS, and 30 nt downstream of the annotated TIS; 3 nt periodicity does not occur upstream of predicted TISs (truncations), but does occur upstream of annotated TISs (extensions)
