
Fig. 1.
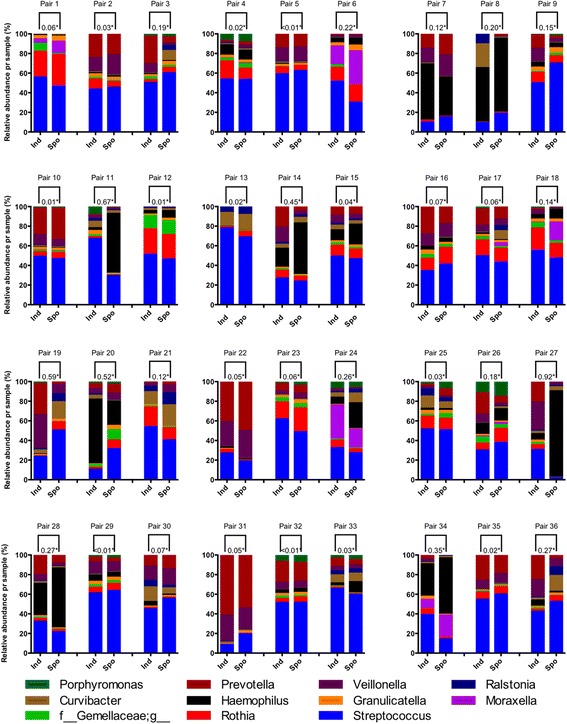
Compositional taxonomic differences for each sample pair** on genus level for the 11 most dominating taxa***. * Yue-Clayton dissimilarity = Range 0-1. **Pair 1-11: Stable state Pair 12-36: Exacerbation. ***OTUs containing <1% of sequences were omitted from the data before performing taxonomic summaries (GreenGenes database level 6 = genus)