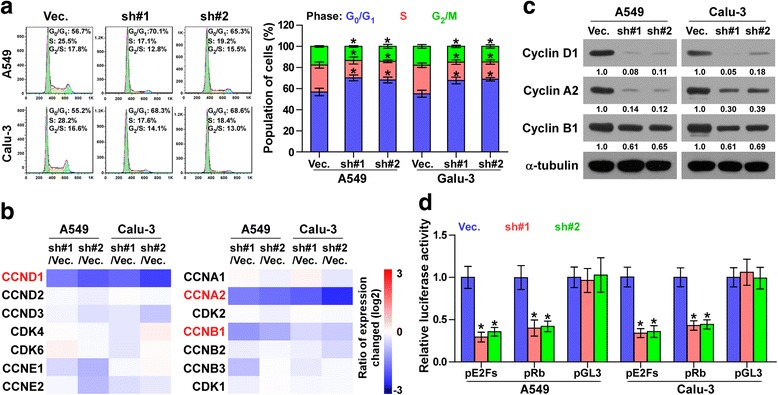
Fig. 5.

Silencing PLPP4 inhibited cell cycle progression in lung carcinoma cells. a Flow cytometric analysis of the indicated lungcarcinoma cells. Each bar represents the mean values ± SD of three independent experiments. *P < 0.05. b Real-time PCR analysis of multiple cell cycle regulators in the indicated cells. Transcript levels were normalized by GAPDH expression. c Western blot analysis of multiple cell cycle regulators expression in the indicated cells. α-Tubulin was used as the loading control. Protein expression levels of cyclin D1, A2 and B1 were quantified by densitometry using Image J Software, and normalized to the corresponding expression levels of α-tubulin. Sample 1 was used as the standard. d Relative E2F and Rb reporter activity in the indicated cells. Each bar represents the mean values ± SD of three independent experiments. *P < 0.05
