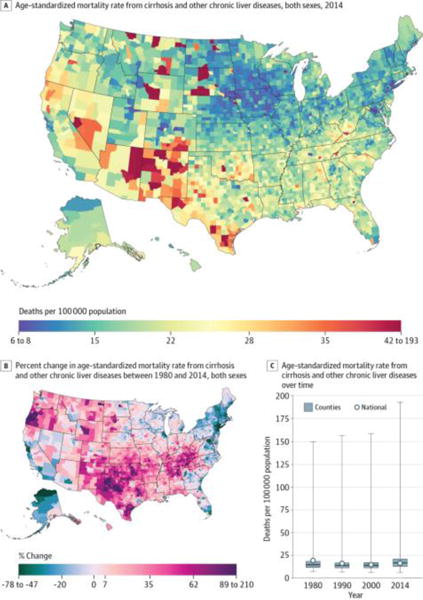
Figure 9. County-Level Mortality From Cirrhosis and Other Chronic Liver Diseases.

A, Age-standardized mortality rate for both sexes combined in 2014. B, Percent change in the age-standardized mortality rate for both sexes combined between 1980 and 2014. A and B, The color scale is truncated at approximately the first and 99th percentiles as indicated by the range given in the color scale. C, Age-standardized mortality rate in 1980, 1990, 2000, and 2014. The bottom border, middle line, and top border of the boxes indicate the 25th, 50th, and 75th percentiles, respectively, across all counties; whiskers, the full range across counties; and circles, the national-level rate.
