
Figure 2. The beam profile of the handheld laser.
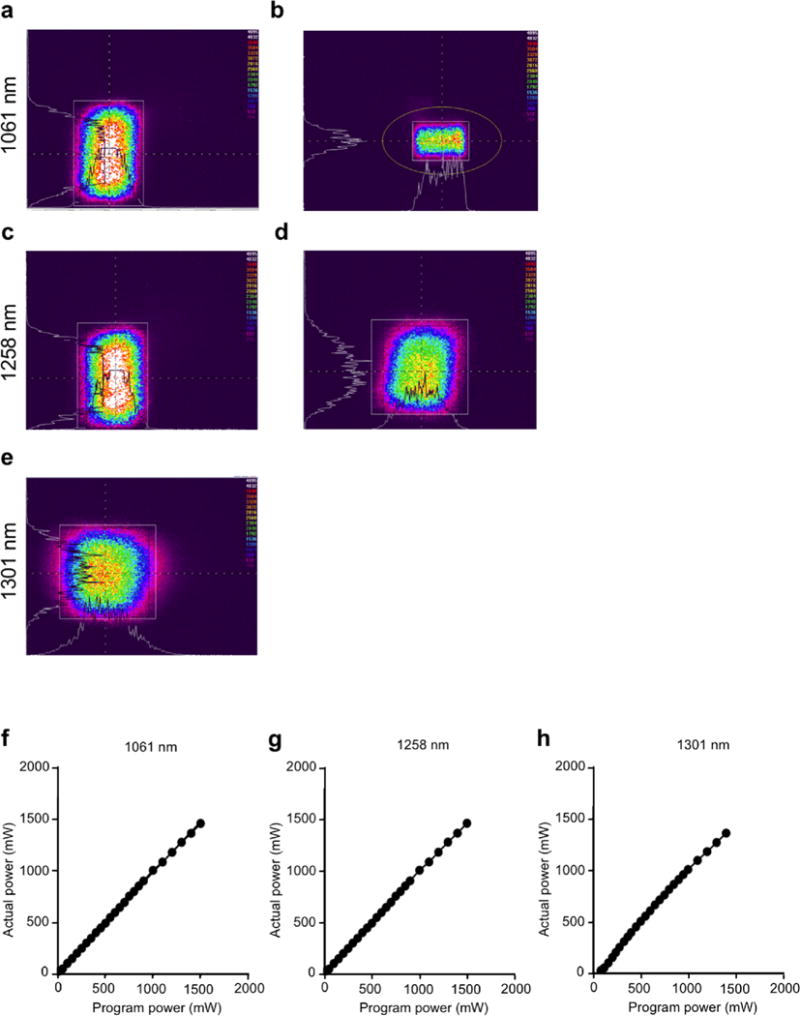
The beam profiles revealed with an IR camera for the 1061 nm (a), uncorrected (b), corrected with nosecone, 1258 nm (c), uncorrected and (d), c corrected with nosecone and 1301 nm (e), uncorrected images. The 1301 nm laser produced a square spot from the onset, hence no nosecone was needed for this testing. The colors indicate the intensity of the energy emitted from the laser. The intensity level is arbitrary. The white lines on the horizontal and vertical axis are the intensity profiles across the center of each spot. The white box and orange circle are used by the imaging software for identifying areas of interest. (f–h), input power was plotted against output power. Average output powers were determined using a power meter. (f), 1061 nm, (g), 1258 nm and (h), 1301 nm wavelength laser diodes where (actual power) =0.9842 (Program power) + 11.04 (linear regression, R2=0.9998), (actual power) = 0.9775 (Program power) + 9.238 (linear regression, R2=0.9996), (actual power) = 1.027 (Program power) – 28.64 (linear regression, R2=0.9964). The actual power delivered is equal to the programmed to within ± 5% which enables the researcher to consistently and repeatedly obtain and use the parameters without using a calibration factor. Data are representative of three independent experiments.