
Figure 6. Task-evoked BOLD responses align closely with individual-specific networks derived from resting-state data.
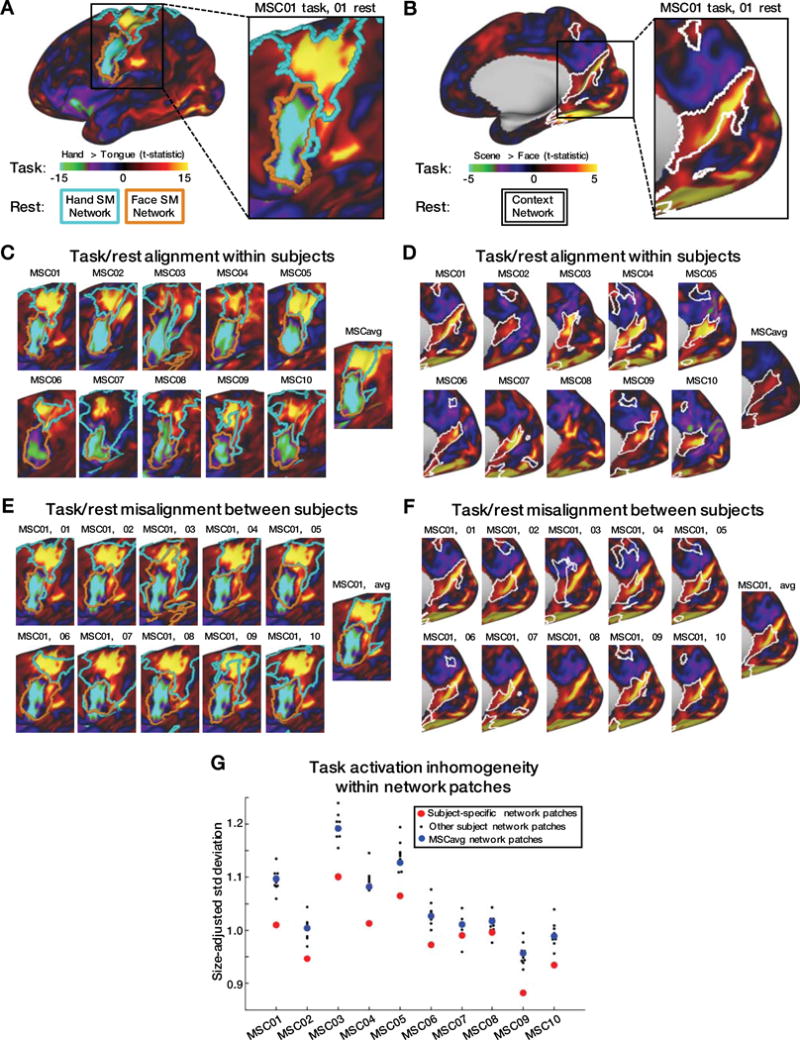
A,B: Hand > Tongue (A) and Scene > Face (B) task contrast maps for a single subject. Boundaries of this subject’s hand Somatomotor (cyan), face Somatomotor (orange) (A), and Contextual Association (B) RSFC networks are shown on the same surface. C,D: Hand > Tongue (C) and Scene > Face (D) task contrasts and RSFC network boundaries for each subject. E,F: Hand > Tongue (E) and Scene > Face (F) task contrasts from MSC01, compared to network boundaries of every subject. G: In each subject, the t-map inhomogeneities across many task contrasts was lower within all pieces of the subject’s own RSFC networks (red) than within pieces of other subjects’ networks (black) or group-average networks (blue). Seven task contrasts were tested: 1) Tongue motion > baseline; 2) Left Hand motion > Right Hand motion; 3) Left Leg motion > Right Leg motion; 4) Face stimulus > Word stimulus; 5) Scene stimulus > Face stimulus; 6) Glass dot pattern > baseline; 7) Noun/Verb stimulus > baseline.