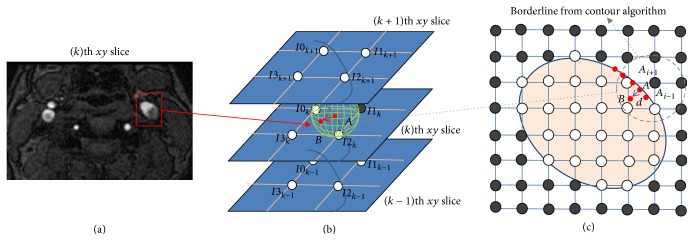
Figure 1.
Calculation of TOF-MRA signal intensity gradient (SIG). (a) TOF-MRA axial source image. (b) 3-dimensional gradient vector (red arrow) of the maximum intensity change. (c) Positioning of points (A and B): point A is a reference point on the artery wall (contour line) and point B is 0.03 mm distant from point A.

