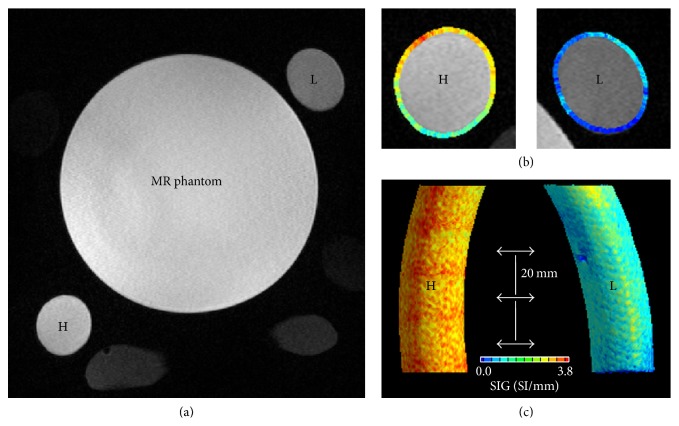
Figure 3.
A phantom experiment: flow-rate dependency of TOF-MRA SIG. (a) Two tubes (80 mm length) of high flow rate (H, 12.5 ± 2.3 L/min of mean flow rate) and low flow rate (L, 8.5 ± 2.6 L/min). In the middle, a MR phantom was observed. (b) Axial view of TOF-MRA SIG in the H and L tubes. (c) 3D reconstructed tubes depicting TOF-MRA SIG: TOF-MRA SIG values were significantly higher in the H tube (mean ± SD, 2.2 ± 0.4, SI/mm) than in the L tube (0.9 ± 0.3, p < 0.001). TOF-MRA SIG values were measured at three levels at 20 mm intervals.

