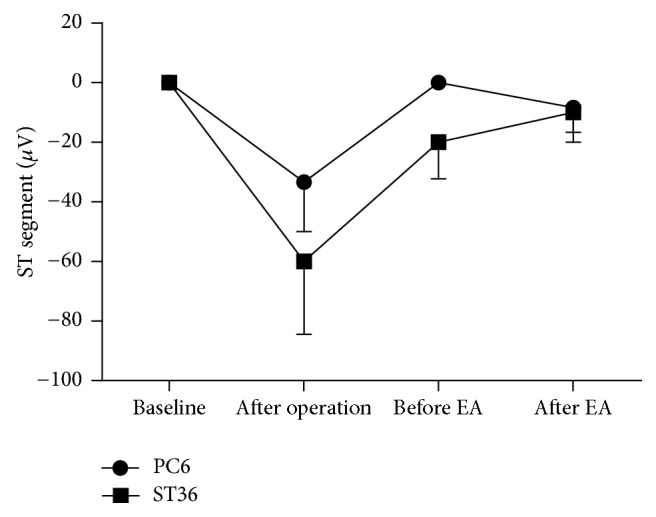
Figure 3.

The variation tendency of the ST segment amplitude of lead II. The ECG was taken at the normal condition, at the 4th week after operation, and at the 6th week after operation (before and after EA). The declined ST segment amplitude decreased after acupuncture both in the PC6 group (n = 6) and in the ST36 group (n = 5). But there were no significant statistical differences. Data are expressed as mean ± SEM. Statistical analysis was performed by Wilcoxon signed-ranks and Mann-Whitney.
