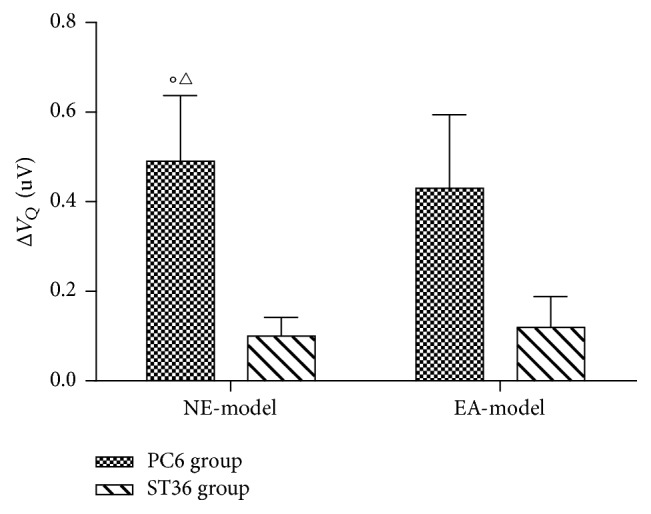
Figure 4.

The changed amplitude of pathological Q wave. The figure shows the changes in pathological Q wave amplitude of lead V1, which is the differences of pathological Q wave amplitude after needle-embedding (NE) or electroacupuncture (EA) and after the operation. The amplitude of pathological Q wave decreased significantly after NE at PC6 acupoint (○P = 0.029, compared with 0 mV), and there was statistical difference between the PC6 and ST36 group (△P = 0.034, compared with that of the ST36 group). Data are expressed as mean ± SEM and were analyzed by t-test. N = 5 in both PC6 group and ST36 group. One minipig in the PC6 group did not record complete ECG.
