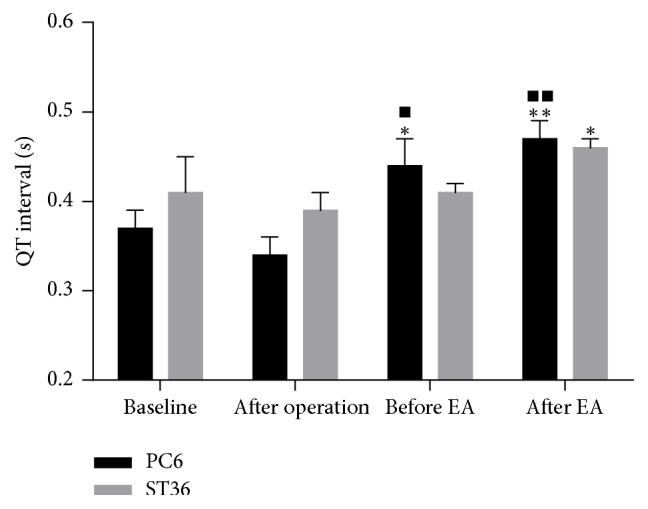
Figure 5.

Lead II QT interval of the PC6 group and ST36 group. Data are expressed as mean ± SEM and were analyzed by t-test. ∗P < 0.05 and ∗∗P < 0.01, compared with that after operation in the same group. ■P < 0.05 and ■■P < 0.01, compared with the baseline of the PC6 group. The QT interval of the PC6 group prolonged significantly compared with that after operation (P = 0.021, after NE; and P = 0.003, after EA). The QT interval of the ST36 group prolonged significantly after EA compared with that after operation (P = 0.024). The QT interval of the PC6 group prolonged significantly compared with the normal condition (P = 0.021, after NE; and P = 0.004, after EA).
