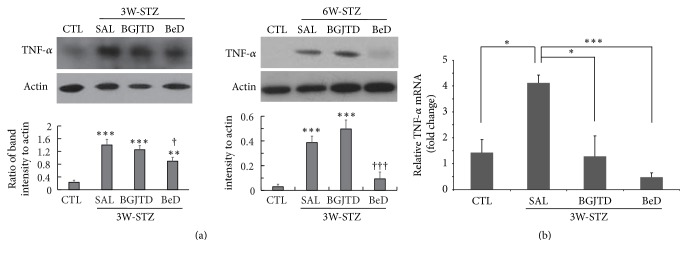
Figure 3.
Comparison of TNF-α levels in the sciatic nerve of STZ-diabetic animals after herbal drug treatments. (a) Western blot analysis of TNF-α in the sciatic nerves from 3W-STZ and 6W-STZ animal groups. Animals were injected with STZ and, 1 week and 4 weeks later, subjected to daily administration of herbal drugs for 2 weeks (labeled 3W-STZ and 6W-STZ, resp.). Images in the upper panel show the representatives from 3 independent experiments, and quantitation of protein band intensity relative to actin control is shown in the lower panel. ∗∗p < 0.01, ∗∗∗p < 0.001 versus untreated control (CTL); †p < 0.05, †††p < 0.001 versus saline control. (b) Real-time PCR for the comparison of TNF-α mRNA expression in the DRG neurons among experimental groups. ∗p < 0.05, ∗∗∗p < 0.001. Number of independent experiments = 4.

