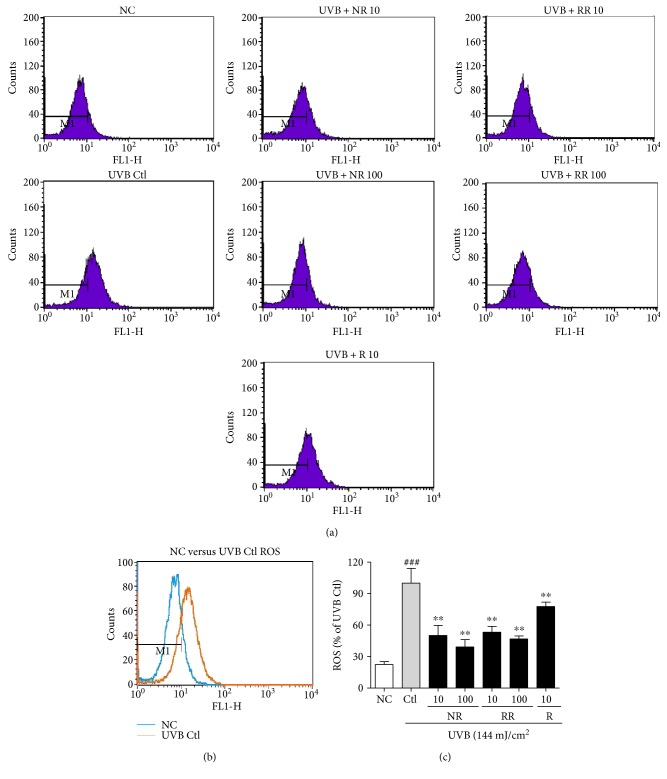
Figure 2.
The levels of ROS in NHDFs treated as indicated for 24 h were measured using flow cytometry with DCFH-DA dye. The number of cells is plotted against the dichlorofluorescein fluorescence detected by the FL-1 channel (a). The relative ROS production of the cells is shown in each histogram (b). Values are mean ± SEM. The labels # and ∗ indicate significant differences (p < 0.05) when compared with the normal control and UV (+) control, respectively. ###p < 0.001 versus the normal control, ∗∗p < 0.01 versus the UVB-irradiated control. NC is normal control, Ctl is UVB control, NR is normal rice, RR is resveratrol-enriched rice, and R is resveratrol. NR and RR were treated in μg/mL, and R was treated in μM.

