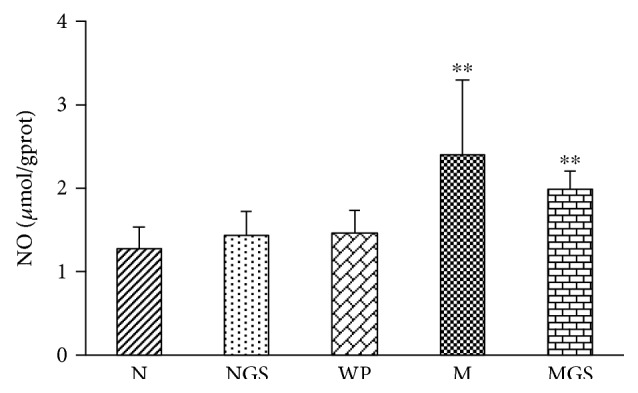
Figure 1.

Brain nitrogen oxide (NO) levels of experimental animals. N: normal rats; NGS: normal rats fed by GS; WP: rats housed in wide platform; M: SD model rats; MGS: SD model rats fed by GS. Significant differences were determined by one-way ANOVA. ∗∗P < 0.01 versus the N group.
