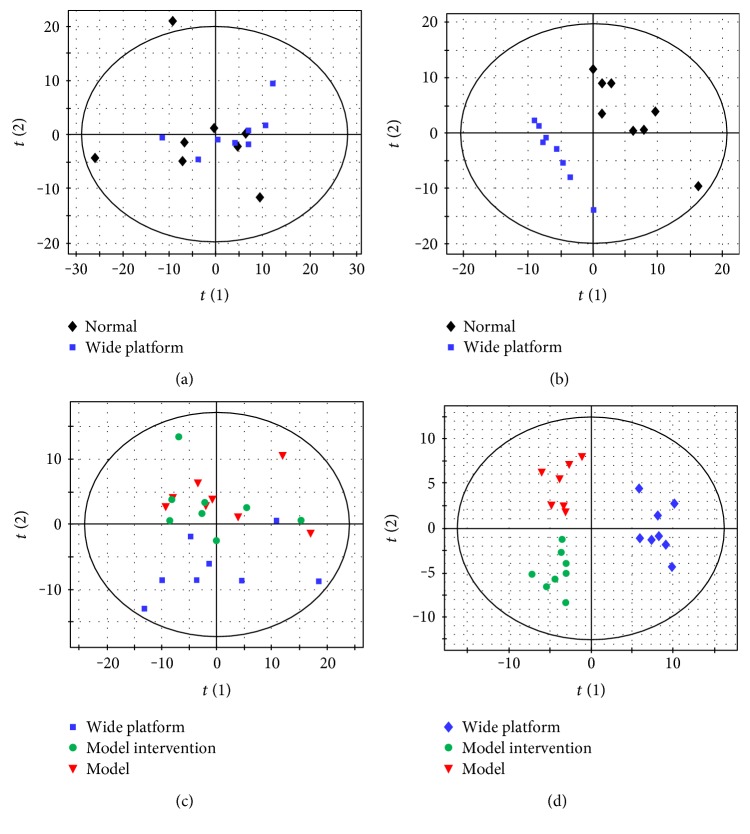
Figure 3.
Score plots of multivariate statistical analysis on brain tissues. (a) PCA score plot of normal group versus wide platform (WP), (b) PLS-DA score plot of normal group versus wide platform (WP) group, (c) PCA score plot of WP, M, and model with GS intervention (MGS) groups, (d) PLS-DA score plot of WP, M, and MGS groups.

