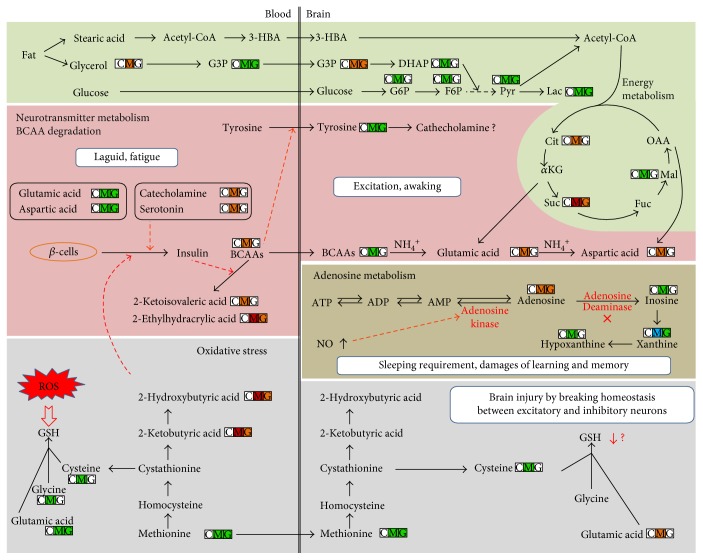
Figure 4.
Proposed metabolic mechanism by SD and total ginsenoside intervention. The concentration changes are indicated in three small boxes with different colors and alphabets, where the box with “C,” “M,” and “G” represents WP group (as control group), model group, and GS intervention on model group. Red color indicates elevated level than WP group, while green color indicates decreased level than WP group. Red dash arrow represents suppression.

