
Figure 4. Food Intake and Wheel-Running Activity in Mice Provided with an Alternate Day (AD) Feeding.
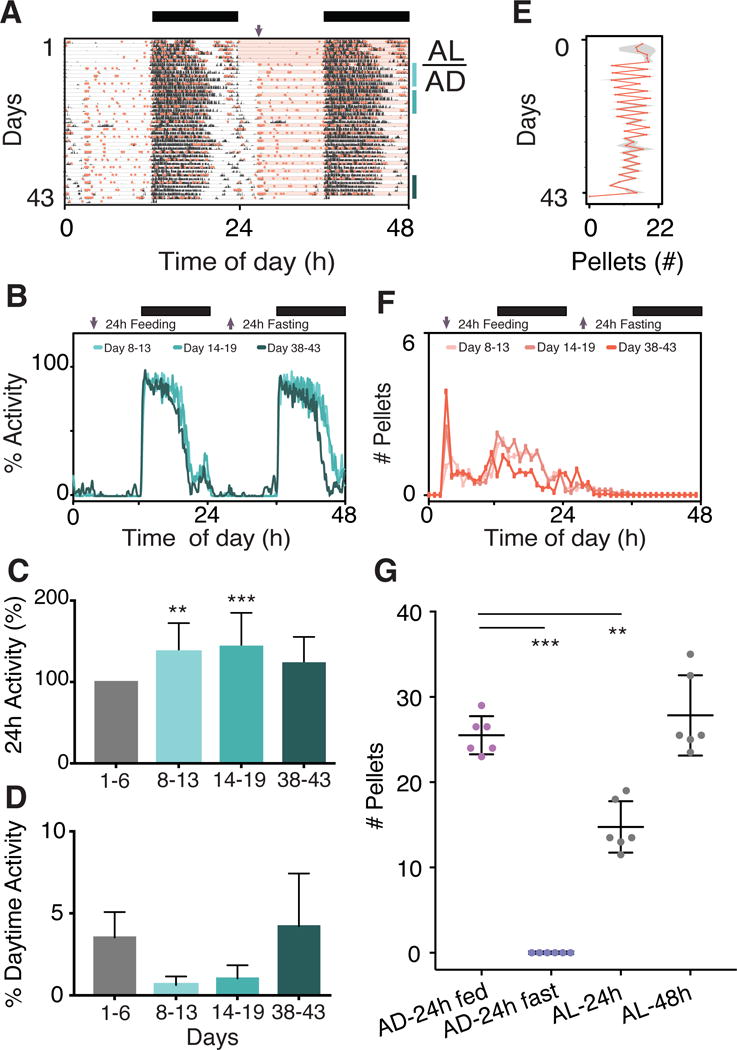
(A) Representative double-plotted actogram of a mouse in the AD condition. Pink shading represents time of food availability and purple arrows indicate food onset. Bars on right side show recording days used for analysis; from 8 to 13 (light-blue), 14 to 19 (aqua) and 38 to 43 (dark green), respectively. The LD cycle is shown in the bar across the top.
(B) Average 48h wheel-running activity profiles, normalized to maximum wheel counts recorded during baseline (n=6). The graph is plotted over 48 hours showing both the feeding (left) and fasting (right) days, with increased activity duration on fasting days. Arrows indicate food on and food off. The LD cycle is shown in the bar across the top.
(C) Total activity increases transiently over the course of the experiment for AD fed mice. Activity is normalized to total activity recorded during baseline (gray). Significant difference from baseline (gray bar) is determined by ANOVA with Bonferroni’s correction where ** p < 0.01, and *** p < 0.001. Data are represented as mean ± SD (n=6).
(D) AD condition does not alter percentage of wheel-running activity occurring in the light. Significant difference from baseline condition (gray bar) is determined by ANOVA with Bonferroni’s correction where * p < 0.05, ** p < 0.01, and *** p < 0.001. Data are represented as mean ± SD (n=6).
(E) The mean total pellets (± SD) consumed per day by mice in the AD condition (n=6). Fluctuations in number of pellets taken per day reflect fasting versus feeding days, although feeding windows span two 24h periods. Each pellet weighs 0.315g with energy intake equal to 3.35Kcal/g of diet.
(F) Average 48h pattern of food intake for AD mice (n=6) shows a sharp peak of food intake once food becomes available on feeding day. The graph is plotted over 48 hours showing both the feeding (left) and fasting (right) days. Arrows indicate food on and food off. The LD cycle is shown in the bar across the top.
(G) In 24h of food access, AD mice consume as much food as AL mice do over 48h. Significant difference determined by ANOVA with Bonferroni’s correction with *** p < 0.001. Data are represented as mean ± SD (n=6).
See also data for individual mice plotted in Figures S3F and S4F.