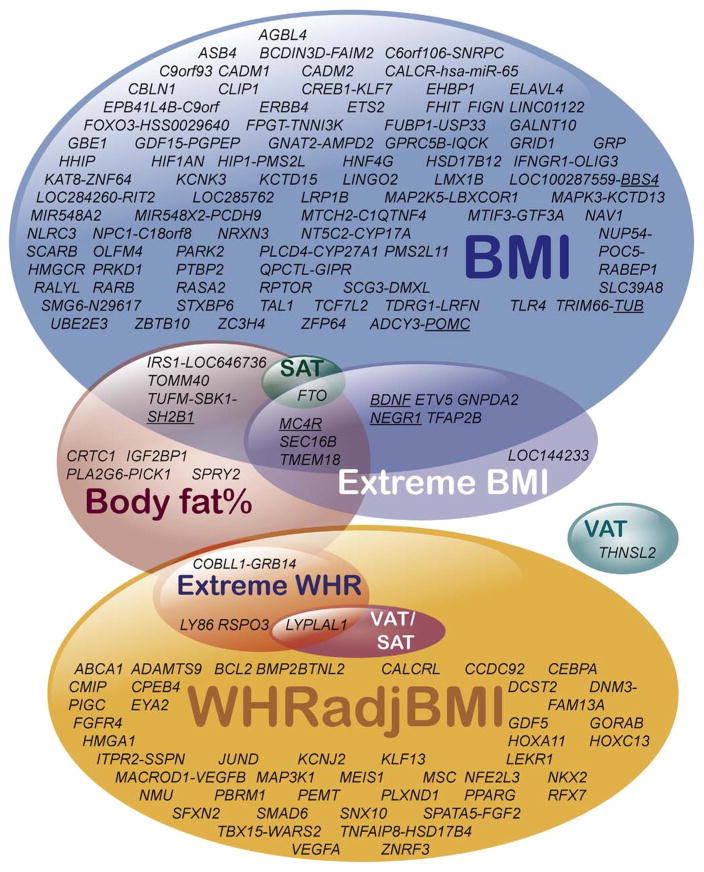
Figure 3.
Venn diagram for loci associated with BMI (Locke 201524), body fat percentage (Lu 201635), waist-hip-ratio adjusted for BMI (Shungin, 201529), VAT, SAT, and their ratio (VAT/SAT) (Fox, 201237), and extremes of body mass index and waist-hip-ratio (Berndt, 201332). Genes implicated in monogenic obesity are underlined. Loci are named according to nearby genes by the original authors, but are not necessarily proven to be the causal gene.

