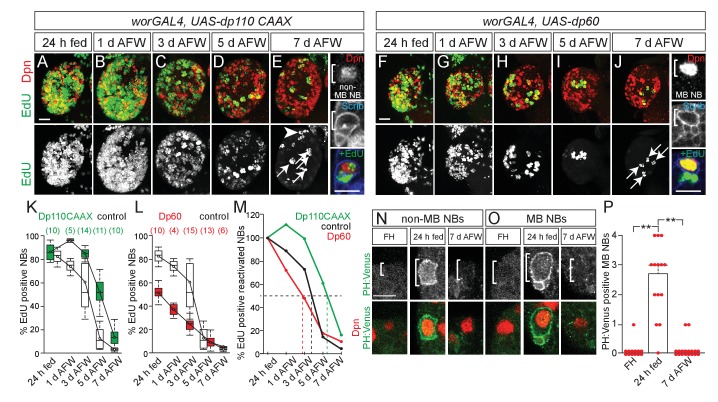
Figure 2. MB NBs proliferate in a PI3-kinase-independent manner during dietary amino acid withdrawal, but not non-MB NBs.
(A–J) Maximum intensity projections of single brain hemispheres, top panel colored overlay with single-channel greyscale image below. Genotypes listed above and molecular markers to the left. Scale bar, 20 µm. White arrows designate the four MB NBs. Arrowhead in E indicates non-MB NB shown to the right. (E,J) Single channel greyscale images of NBs at higher magnification on the right with colored overlay below. Scale bar, 10 µm. NBs in white brackets. (K,L) Box plots of the percent of EdU-positive NBs per brain hemisphere at the indicated time points. Numbers in parentheses indicate the number of brain hemispheres analyzed at each time point, color corresponds to genotype. (M) Percent of EdU-positive NBs normalized to the percent of reactivated NBs after 24 hr of feeding. Dotted lines indicate the time at which 50% of reactivated NBs are EdU-positive. Single channel greyscale images with color overlay below of non-MB NBs (N) and of MB NBs (O) at indicated time points listed above with reporter and molecular markers listed to the left. White brackets denote NBs. and scale bar (N) equals 10 µm. (P) Histogram of average number of MB NBs positive for membrane PH:Venus fluorescence. p-values are 2.7 × 10⁻⁷ and 6.9 × 10⁻⁹, respectively (Student's t-test). Small circles denote primary data.


