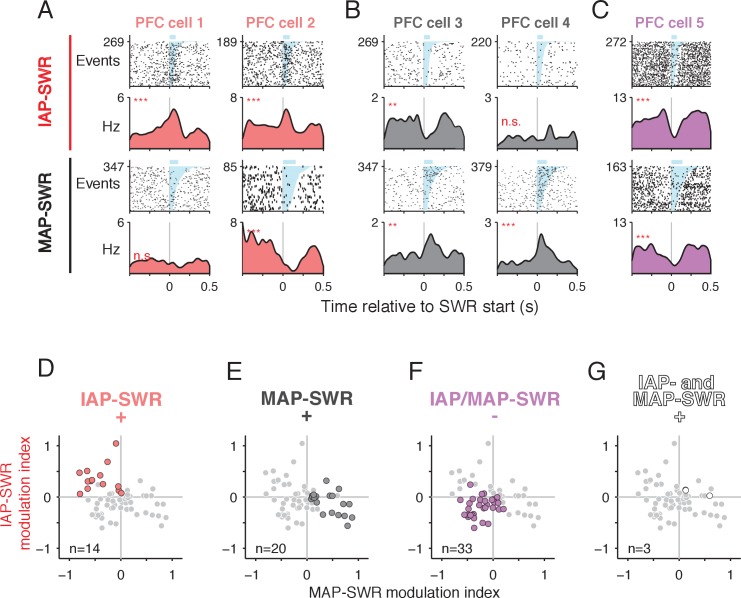
Figure 5. PFC modulation during SWRs distinguishes between MAP- and IAP- SWRs.
(A-C) PFC spiking activity aligned to SWRs. Spike raster (first and third rows, number of SWR events shown on y axis) and mean firing rate (second and fourth rows) for each cell are shown. Upper two rows: firing aligned to IAP-SWRs. Lower two rows: firing aligned to MAP-SWRs. SWRs are sorted by length (shaded in cyan, mean duration shown by blue bar above raster). n.s. not significant, **p<0.005 and ***p<0.0005 using a circular permutation test (Materials and methods). (A) Two example cells showing a significant increase in firing during IAP-SWRs but no change (cell 1) or a significant decrease in firing (cell 2) during MAP-SWRs. (B) Two example cells showing a significant increase in firing around MAP-SWRs but no change (cell 3) or a significant decrease in firing (cell 4) during IAP-SWRs. (C) Example cell showing significant decreases in firing during both IAP-SWRs and MAP-SWRs. (D-G) PFC units showing significant changes in activity during SWRs (n = 70, gray circles) classified into one of four groups (colored circles), based on the significance of their modulation indices for IAP-SWRs (y axis) and MAP-SWRs (x axis). The gray circles are repeated in each panel and the colored circles highlight cells belonging to each group (cell count shown in each panel). (D) Significantly excited only during IAP-SWRs (IAP-SWR+) (observed = 14, expected = 18, Binomial test n.s.). See Materials and methods for calculation of expected values. (E) Significantly excited only during MAP-SWRs (MAP-SWR+) (observed = 20, expected = 18, Binomial test n.s.). (F) Significantly inhibited during either or both IAP-SWRs and MAP-SWRs (IAP/MAP-SWR-) (observed = 33, expected = 26, Binomial test: n.s.). (G)Significantly excited during both IAP-SWRs and MAP-SWRs (IAP- and MAP-SWR+) (observed = 3, expected = 9, Binomial test: p<0.05). Fewer than the expected number of cells was observed in this group.


