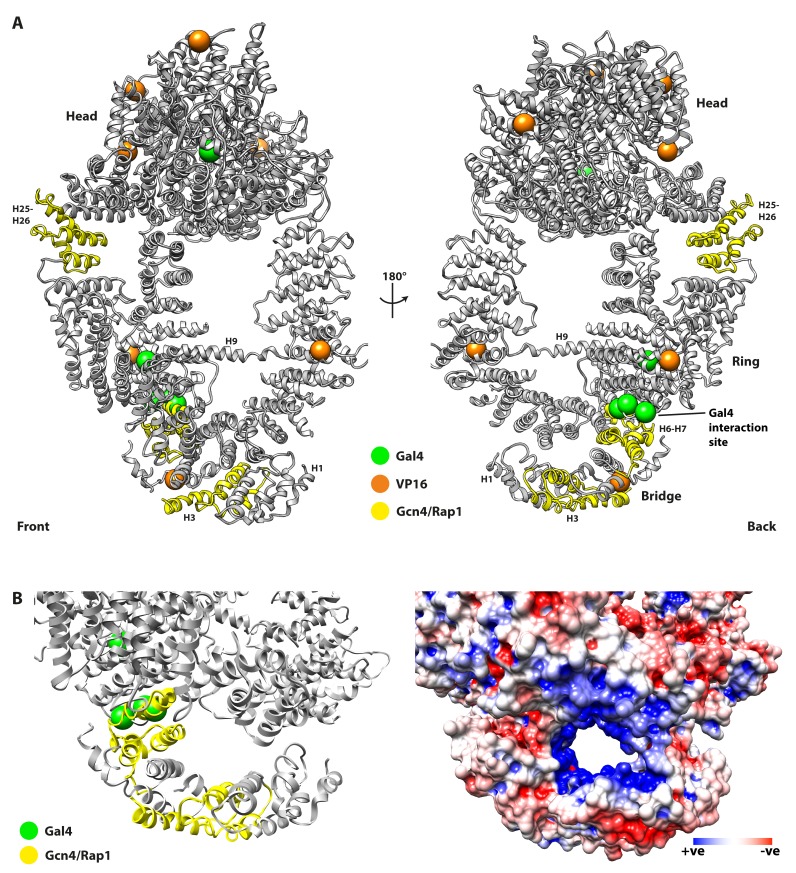
Figure 4. Mutations of Tra1 that disrupt activator targeting are distributed across the Tra1 structure.
(A) Front and back view of Tra1 are shown together with mutations that disrupt activator targeting of SAGA/NuA4. Tra1 is shown as grey ribbon, and locations of amino acid substitutions and deletions are shown as spheres and yellow ribbon respectively. (B) Left panel shows a close up view of the N-terminal region of the Finger and its position relative to the Ring, with mutations that impair activator recruitment coloured as in Figure 4. Right panel has the same view but showing an electrostatic surface potential, highlighting the negatively charged channel that is lined by the Finger and Ring regions. Electrostatic surface potentials were calculated using PDB2PQR (Dolinsky et al., 2007) and APBS (Baker et al., 2001) tools implemented in Chimera.

