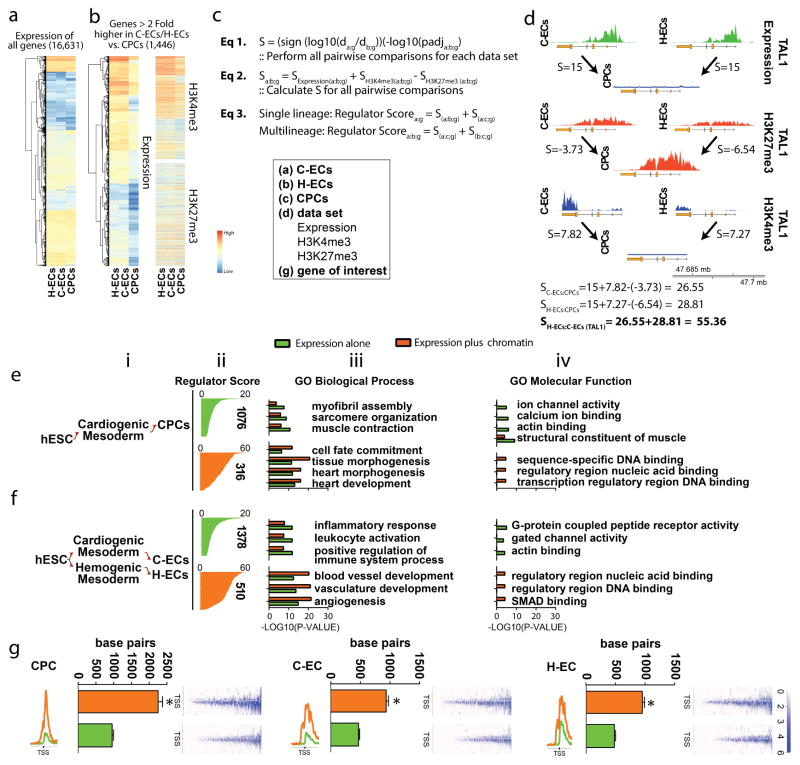
Figure 2. Lineage-specific molecules involved in cell fate determination are enriched by hierarchical ranking of genes based on chromatin dynamics and gene expression.
(a) Heat map of all genes analyzed which was reduced to (b) those genes (expression and chromatin heat maps shown) that are >2 fold higher in a given population. In this example genes greater than 2 fold higher in C-ECs and H-ECs vs. CPCs are shown. (c) Equations used to generate scoring for regulator list hierarchy. (d) Raw data and correlative score generated based on analysis of the TAL1 gene. (e–f) Regulator lists generated using ranking algorithm outlined in a–d were analyzed by gene ontology analysis with data shown for CPCs (e) and pan-ECs (f). Data are presented as (i) lineage map of population under evaluation, (ii) genes ranked on the basis of cumulative score for regulators based on expression (green) or expression plus chromatin (orange). The number of genes in each regulator list is shown to the side of each graph. (iii–iv) Statistical analysis of gene ontology enrichment categories for Biological Process (iii) and Molecular Function (iv) as a comparison of regulators identified by expression alone (green) or expression plus chromatin (orange). (g) H3K4me3 chromatin breadth 5000 bp upstream and downstream of the TSS for putative regulators identified by expression alone (green) or expression plus chromatin (orange) in CPCs, C-ECs, and H-ECs. Raw H3K4me3 deposition around the TSS for all genes in the list are shown to the right of each graph.

