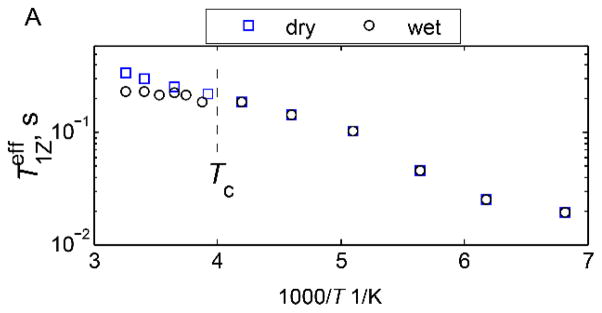
Figure 31.
Plots of for the methyl groups of M35 in amyloid fibrils comprised of amyloid-β protein in the hydrated (black) and dry (blue) states. The dotted lines indicate the dynamical transition temperature Tc. Adapted with permission from (66), Copyright (2016) Elsevier, License 3995621063676.

