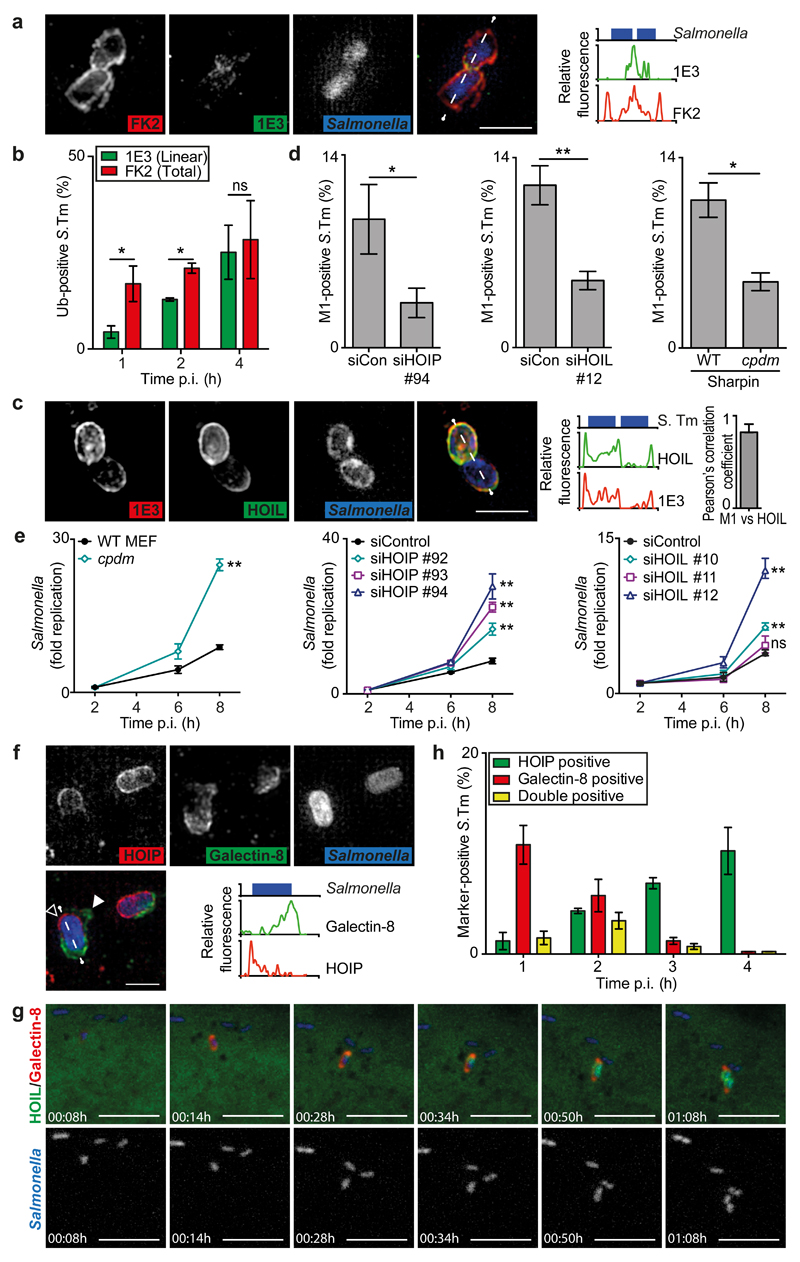
Fig.1. LUBAC synthesizes M1-linked ubiquitin chains on cytosolic S.Typhimurium and restricts its proliferation.
(a,c,f) Structured illumination micrographs. MEFs infected with BFP-expressing S.Typhimurium, PFA-fixed at (a,c) 90min or (f) 1h post infection (p.i.) and stained for (a) total (FK2, red) and M1-linked (1E3, green) polyubiquitin, (c) co-expressing GFP:HOIL-1, Flag:HOIP and Flag:Sharpin and stained for M1-linked (1E3, red) polyubiquitin, or (f) expressing mCherry:HOIP and stained for Galectin-8 (false-coloured green); empty arrowhead indicates region with no galectin-8 and filled arrowhead indicates retracting Galectin-8+ve membrane. Line graphs show fluorescence plots along indicated lines. Data are representative of n>5 images from at least three independent experiments. Scale bar 2μm. (c) Far right graph Pearsons’s correlation coefficient of M1-linked polyubiquitin and HOIL. Mean±SD of n=5 images
(b,d,h) Percentage of marker-positive S. Typhimurium as counted by eye using widefield microscopy at 90 min p.i. or at the indicated time points in PFA-fixed MEFs (b,d) stained with antibodies 1E3 for M1-linked and FK2 for total polyubiquitin or (h) expressing GFP:HOIP and mCherry:galectin-8. Mean±SEM of triplicate coverslips from three independent repeats, n>100 bacteria per coverslip. *p<0.05, **p<0.01, Student’s t-test.
(e) Fold replication of S.Typhimurium in siRNA-treated or Sharpincpdm MEFs. Bacteria were counted based on their ability to grow on agar plates. Mean±SD of triplicate MEF cultures and duplicate colony counts, representing three independent repeats. ns=non-significant, **p<0.01, one-way ANOVA with Dunnett’s multiple comparisons test (siRNA-treated MEFs) or Student’s t-test (cpdm MEFs).
(g) Selected frames from live imaging on a confocal spinning disk microscope (see Supplementary Video 1) of MEFs co-expressing mCherry:Galectin-8, GFP:HOIL-1, Flag:HOIP and Flag:Sharpin, infected with BFP-expressing S.Typhimurium and imaged every 2 min. The shown event is representative of >9 videos from three independent experiments. Scale bar 10μm.

