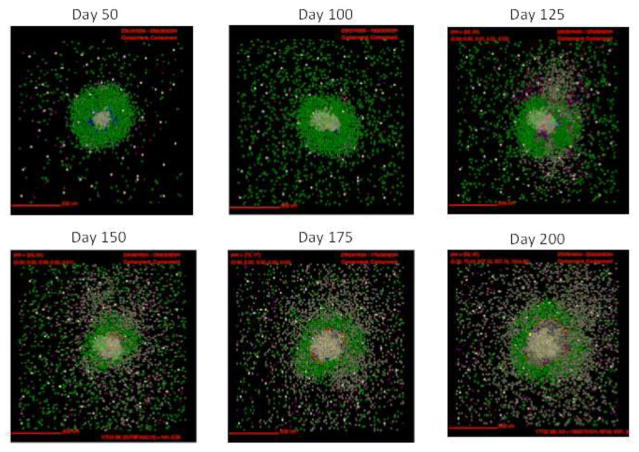
Figure 3. Simulations of cellular localization and granuloma morphology over time.
Representative images of a single granuloma over time generated with baseline parameter set (Table. 1). Shown is simulation of 2mm × 2mm lung tissue. Cells are represented by different colors: resting macrophages are green, activated macrophages are blue, infected macrophages are orange, chronically infected macrophages are red, IFNγ producing T-cells are pink, cytotoxic T cells are violet, regulatory T cells are cyan, fibroblasts are maroon, and myofibroblasts are gold. Caseum is represented in these images as brown compartments. Cytokine distributions are not shown.

