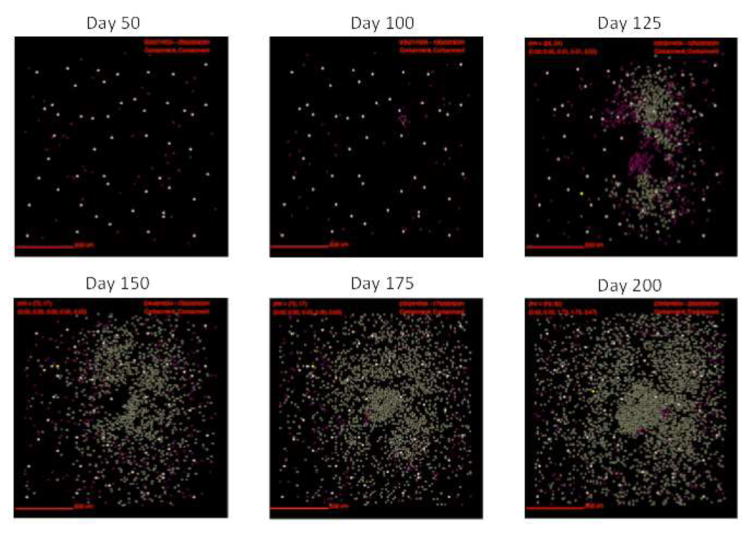
Figure 4. Localization of fibroblasts and myofibroblasts from a simulated fibrotic granuloma over time.
In this representative simulation (same simulation as Figure 3) fibroblasts are represented as maroon, and myofibroblasts are represented as gold. As time progresses the number of both fibroblasts and myofibroblasts increases. They surround and penetrate the granuloma beginning at about 125 day PI.

