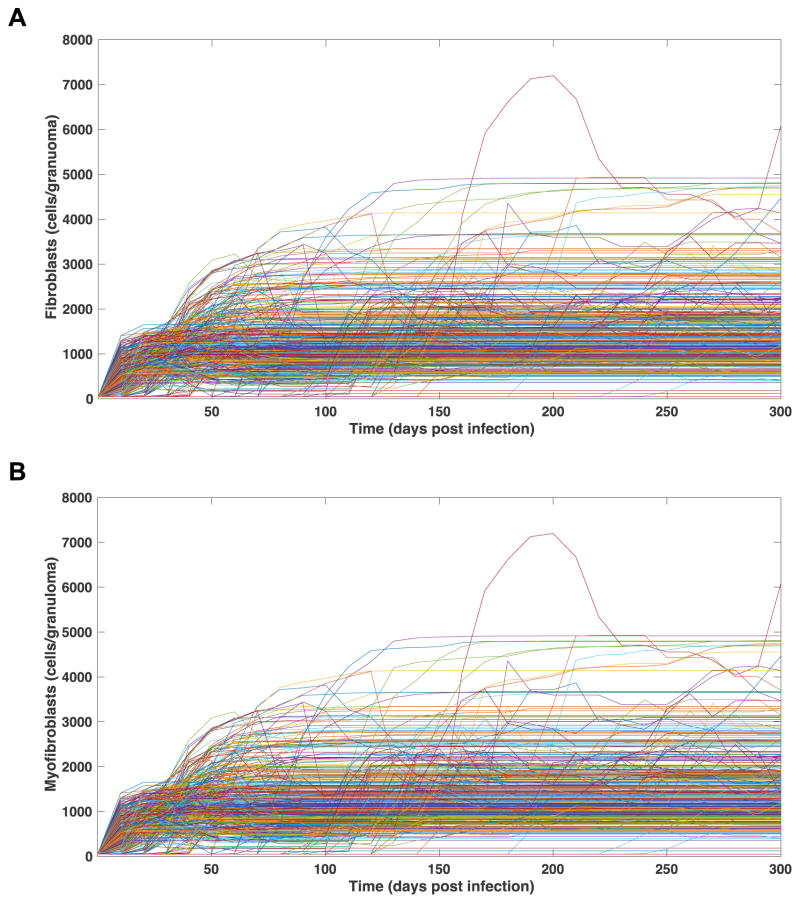
Figure 9. Fibroblast and myofibroblast numbers in 500 simulated granulomas over time.
Each line represents and individual granuloma from the fibrosis parameter set (Table 1). A) Fibroblasts per granuloma over 300 days PI. B) Myofibroblasts per granuloma over 300 days PI.

