
Figure 2. Interactions between NUP components and transiting cilia proteins.
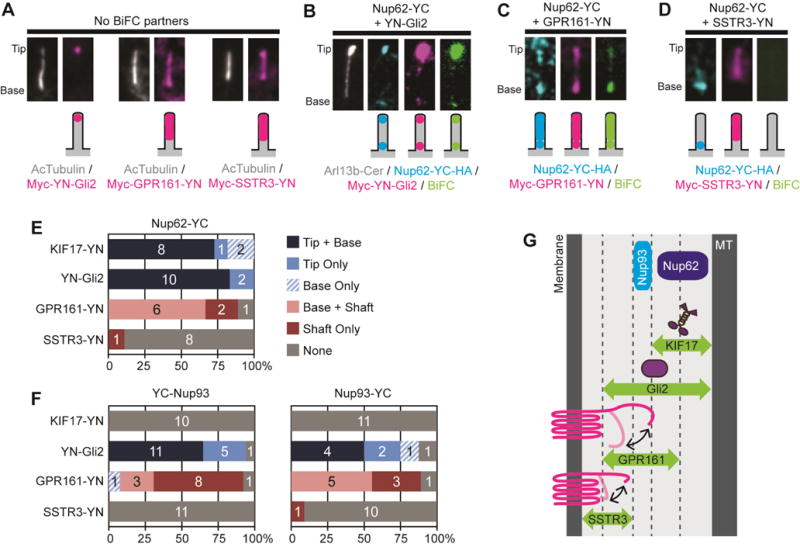
(A) Representative images showing the ciliary localizations of YN-Gli2, GPR161-YN, and SSTR3-YN expressed in the absence of a BiFC partner. (B–D) Representative images and schematic depictions show the locations of BiFC interactions detected for Nup62-YC with (B) YN-Gli2, (C) GPR161-YN, or (D) SSTR3-YN. Proteins were detected with antibodies to the epitope tags. See Table S1 for full description of constructs. See Figure S2 for uncropped images. (E,F) Quantification of the locations of BiFC interactions for (E) Nup62 or (F) Nup93 constructs. The number of cells observed for each BiFC location category is indicated on the bar graph. See Figure S3 for representative images of YC-Nup93 and Nup93-YC BiFC interactions. (G) The BiFC interactions define the locations of Nup62 and Nup93 in the inner region of the ciliary gating zone. MT, axonemal microtubules.