
Figure 4. Interactions between NPHP components and transiting cilia proteins.
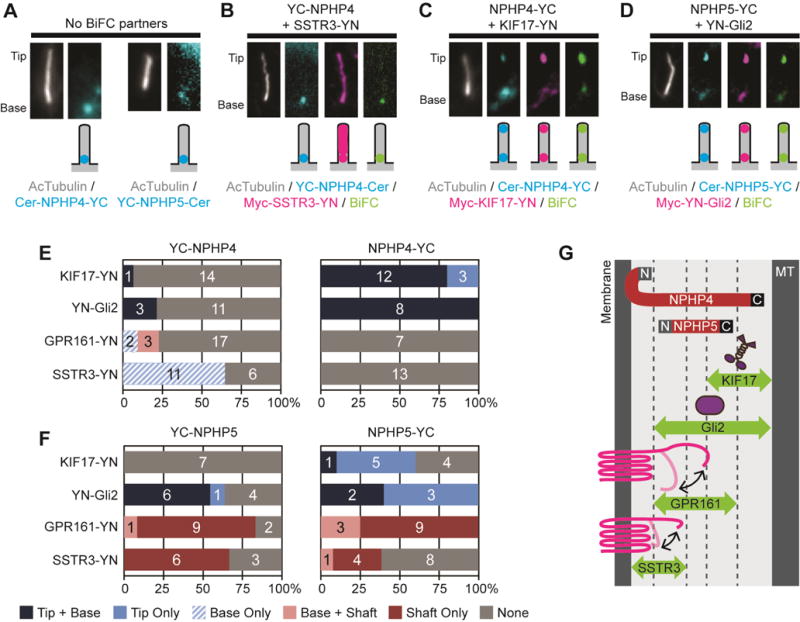
(A) Representative images showing the ciliary localizations of NPHP4-YC and YC-NPHP5 expressed without a BiFC partner. (B–D) Representative images and schematic depictions of BiFC interactions for select NPHP4 and NPHP5 combinations. Proteins were detected with fluorescent tags or with antibodies to the epitope tags. See Table S1 for full description of the constructs. See Figure S6 for representative images. (E,F) Quantification of the locations of the BiFC interactions for (E) NPHP4 or (F) NPHP5 constructs. The number of cells observed for each BiFC location category is indicated on the bar graph. (G) The BiFC assay defines the positions and orientations of NPHP4 and NPHP5 within the ciliary gating zone.