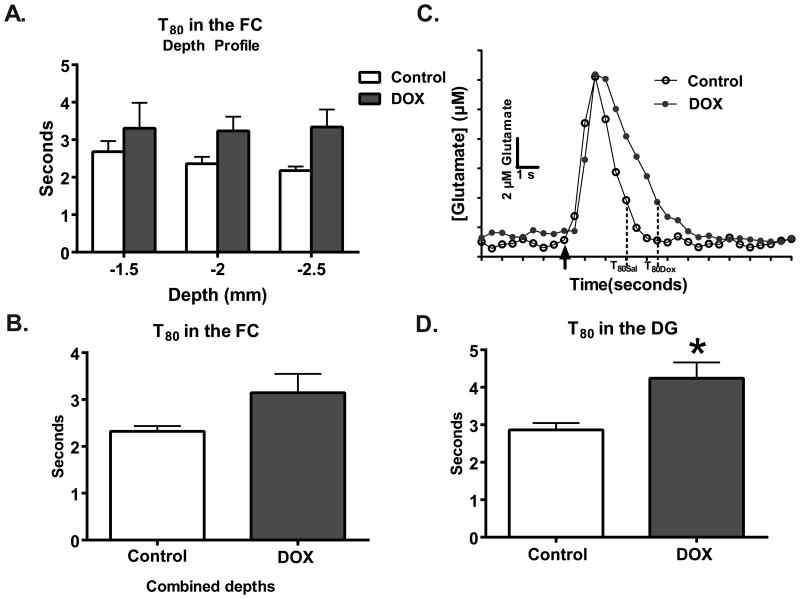
Figure 3.
Clearance times are significantly slower in the DG after DOX treatment. (A) The depth profile of the T80 shows that clearance times as a function of depth and (B) combined to represent the entire region did not differ as a function of treatment (n=6-9). (C) Representative traces (baseline subtracted out) demonstrate the changes in glutamate clearance. The black arrow is where exogenous glutamate was locally applied within the FC. (D) In the DG, a 48% increase in clearance time as a function of DOX treatment (n=7) was also measured in comparison to saline treatment (n=6; *p<0.05). Statistical analyses were carried out using a 2-way ANOVA and unpaired 2-tailed Student's t-tests. Error bars represent the mean ± SEM.

