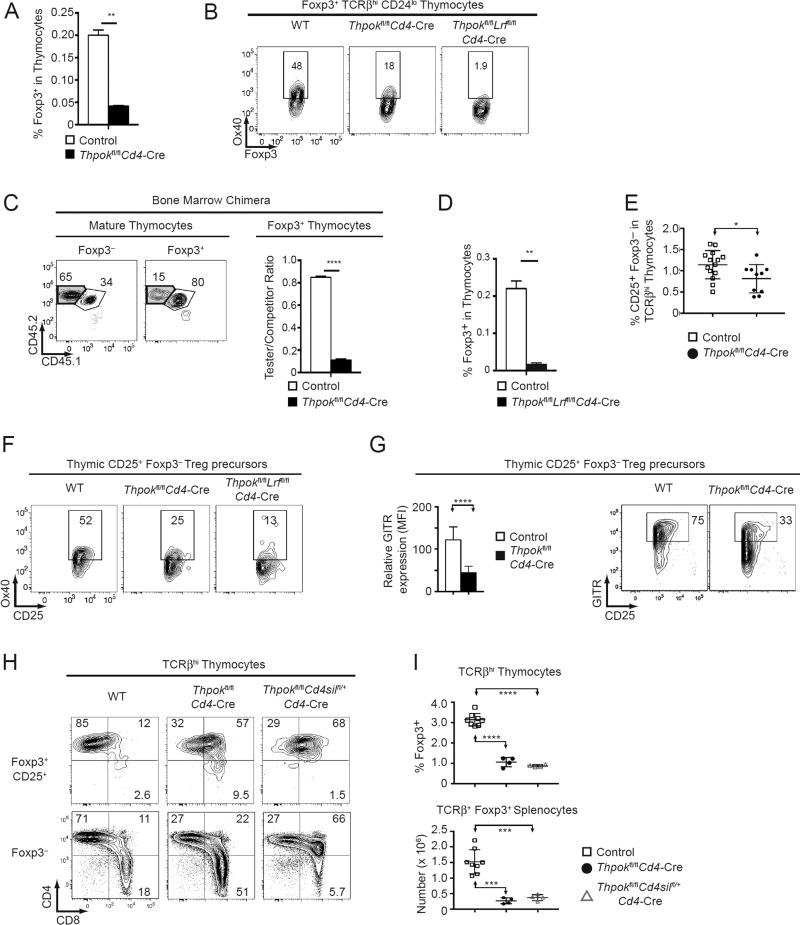
Figure 1. Thpok is important for Treg development in the thymus.
(A, D) Percentage of Foxp3+ cells among total thymocytes from mice of the indicated genotype. Thpokfl/fl Lrffl/fl Cd4-Cre mice and corresponding controls were B2m−/− to exclude MHC I-restricted cells from analyses (D). Data is from three mice of each genotype analyzed in three independent experiments (**: P<0.01).
(B) Expression of intra-cellular Foxp3 vs. surface Ox40 in Foxp3+ TCRβhi CD24lo thymocytes from mice of the indicated genotype. Data is representative of four mice of each genotype analyzed in four independent experiments.
(C) Contour plots (left) show CD45.1 vs. CD45.2 expression on Foxp3− and Foxp3+ TCRβhi CD24lo thymocytes from CD45.1+B2m−/− host mice transplanted with a 1:1 mix of CD45.2+ Thpokfl/flCd4-Cre (tester [Test]) and CD45.1+ CD45.2+ wild-type (WT) (competitor[Comp]) bone marrow. Boxes define populations of Test (purple shaded) and Comp (plain line) origin. Numbers near boxes indicate cell percentages and were used to compute Test/Comp ratios for Foxp3+ and Foxp3− subsets. The bar graph shows [(Test/Comp)Foxp3+/ (Test/Comp)Foxp3−] ratios, respectively on gated Foxp3+ and Foxp3− subsets, in chimeras made with Thpokfl/flCd4-Cre Test bone marrow (filled bar) and in control chimeras made from Thpokfl/fl Test bone marrow (open bar). Data is representative of three recipients per genotype, obtained from two separate bone marrow transplants, each with one donor from each genotype (****: P<0.0001).
(E) Percentage of CD25+ Foxp3− cells among TCRβhi thymocytes from mice of the indicated genotype. Each symbol represents one mouse; data is from eight independent experiments (*: P<0.05, unpaired t-test).
(F) Expression of CD25 vs. Ox40 in CD25+ Foxp3− TCRβhi thymocytes from mice of the indicated genotype. Data is representative of two mice of each genotype analyzed two independent experiments.
(G) Bar graph (left) shows relative expression (MFI) of GITR in CD25+ Foxp3− TCRβhi thymocytes from mice of the indicated genotype. Data is expressed relative to wild type cells analyzed in the same experiment, set to 100, and is from 8 to 10 mice of each genotype analyzed in six independent experiments (****: P< 10−4, unpaired t-test). A representative experiment is shown on the right.
(H) Expression of CD8 vs. CD4 by Foxp3+ (top) or Foxp3− (bottom) TCRβhi thymocytes of the indicated genotype. Data is summarized in (I).
(I) Percentage (thymus, top) and absolute number (spleen, bottom) of Foxp3+ cells in indicated populations from control (open squares), Thpokfl/fl Cd4-Cre (filled circles), and Thpokfl/fl Cd4Silfl/+Cd4-Cre (open triangles) mice. Each symbol represents an individual mouse; data is from two independent experiments. Statistical significance was determined by one-way ANOVA followed by a Tukey’s multiple comparisons test (***: P<0.001 ****: P<0.0001).

