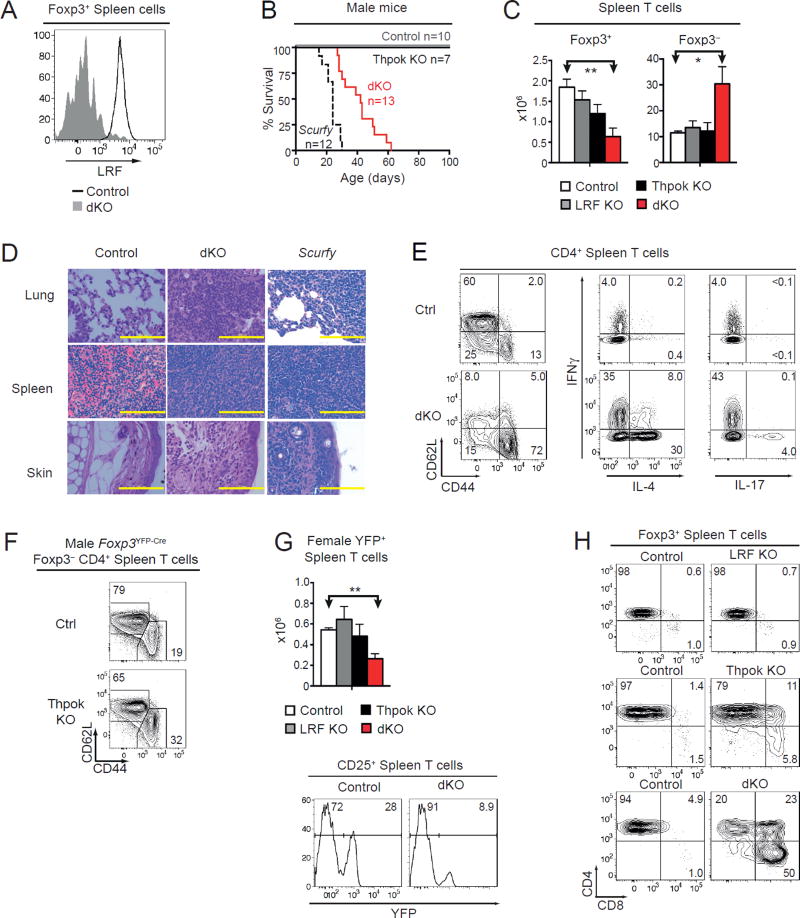
Figure 2. Treg expression of Thpok or LRF is critical for immune homeostasis.
(A) LRF expression in Foxp3+ spleen cells (black line). Foxp3+ cells from dKO mice serve as a negative staining control (grey filled). Data is representative of three mice of each genotype analyzed in three independent experiments.
(B) Survival of Foxp3YFP-Cre control (grey line), Thpok KO (plain black line), dKO (red line), and Scurfy (dashed black line) male mice. Number of mice is indicated in plot. Median survival was 42 days for dKO and 24 days for Scurfy mice.
(C) Absolute number of spleen TCRβ+ Foxp3+ (left), Foxp3− (right) cells from control (open bars), LRF KO (grey bars), Thpok KO (black bars), or dKO (red bars) male Foxp3YFP-Cre mice. Data is from at least three animals per genotype, analyzed in at least three independent experiments (control vs. dKO: P<0.05 [*] and P<0.01 [**]; other differences not significant).
(D) Hematoxylin and eosin stains on paraffin-embedded organs comparing Foxp3YFP-Cre control, dKO, and Scurfy mice, all male. Yellow scale bar is 100µm. Data is representative of five separate samples from mice of each genotype stained in two experiments. At time of analysis, mice were 4–6 weeks (dKO) or 2–4 weeks (Scurfy) old. Control mice were 6–8 weeks old.
(E) (Left) CD44 vs. CD62L expression in Foxp3− CD4+ TCRβ+ spleen cells from control or dKO male mice. (Middle and right) Expression IL-4 (middle) or IL-17 (right) vs. IFNγ in CD4+ TCRβ+ spleen cells from control and dKO male mice after a 3-hour in vitro stimulation and intracellular cytokine staining. Data is representative of three mice of each genotype analyzed in three independent experiments.
(F) Expression of CD44 vs. CD62L on Foxp3− CD4+ TCRβ+ spleen cells from control (top) or Thpok KO (bottom) Foxp3YFP-Cre male mice. Data is representative of three mice of each genotype analyzed in three independent experiments.
(G) (Top) Absolute number of spleen YFP+ TCRβ+ cells from indicated Foxp3YFP-Cre mice female mice. Data is from at least three animals per genotype, analyzed in at least three independent experiments (control vs. dKO: P<0.01 [**]; other differences not significant). (Bottom) Expression of YFP in CD25+ spleen T cells from control and dKO female mice.
(H) CD8 vs. CD4 expression in Foxp3+ TCRβ+ cells from control, LRF KO (top), Thpok KO (middle), or dKO (bottom) male mice. Data is representative of at least three mouse sets analyzed in at least three independent experiments.

