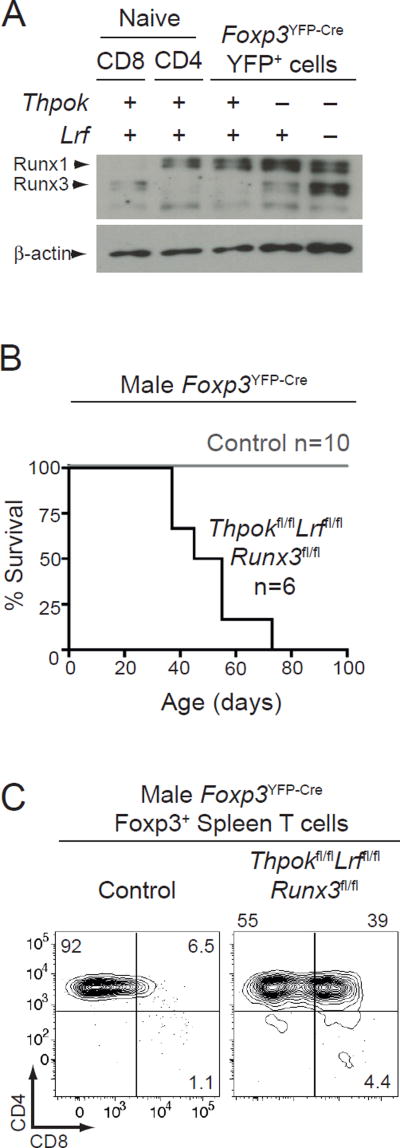
Figure 3. Runx3 independent impact of Thpok and LRF on Treg function.
(A) Immunoblot analysis of Runx protein expression in sorted CD44lo CD25− naive CD4+ and CD8+ cells from WT mice and in YFP+ Tregs from control, Thpok KO or dKO male mice. Each lane is from 105 cells, and expression of β-actin is shown as a loading control. Data is representative of two biological replicates for each sample.
(B) Survival curve of control (grey line) or Thpokfl/flLrffl/fl Runx3fl/fl (black line) Foxp3YFP-Cre male mice. Number of mice is indicated in plot. Median survival for Foxp3YFP-Cre Thpokfl/flLrffl/fl Runx3fl/fl is 50 days. Data from control mice is the same as in Fig. 2B and shown for comparison purposes.
(C) CD8 vs. CD4 expression is shown on Foxp3+ T cells from control or Thpokfl/fl Lrffl/fl Runx3fl/flFoxp3YFP-Cre male mice. Data is representative of three mice of each genotype analyzed in three independent experiments.

