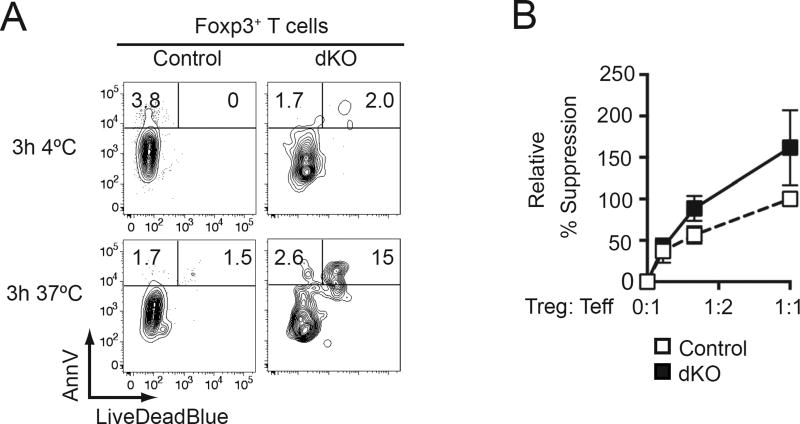
Figure 5. Thpok and LRF promote Treg survival.
(A) LiveDeadBlue vs. Annexin V (AnnV) staining in male control (left) or dKO (right) spleen Foxp3+ cells cultured in medium as indicated. Data is representative of two mice of each genotype in two independent experiments.
(B) Graph indicates percent suppression of wild-type effector T cell proliferation by female dKO (filled squares) or control (open squares) Tregs at indicated Treg: Teff ratios with suppression by control Tregs at a 1:1 ratio set to 100. Data is from at least four animals per genotype analyzed in at least four independent experiments.

