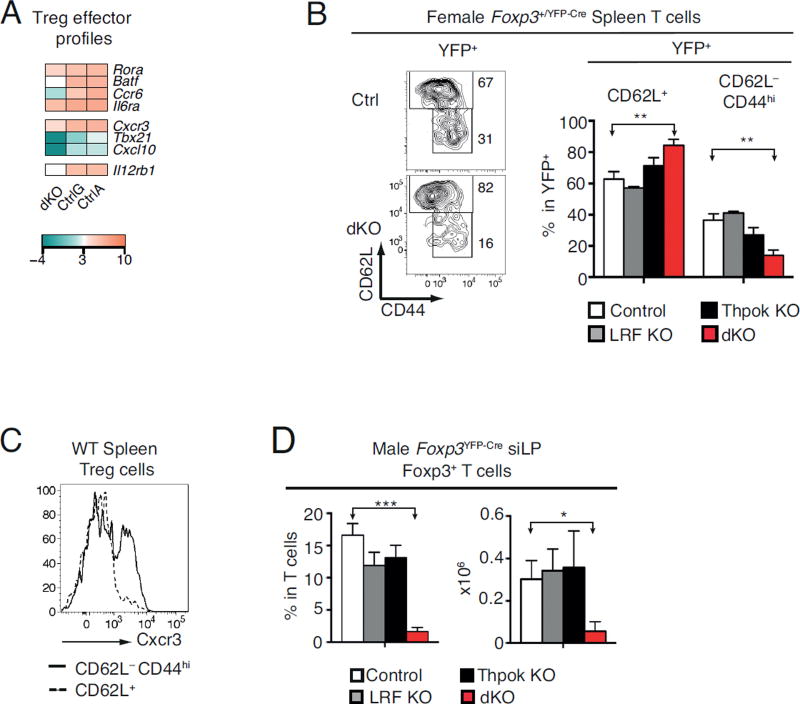
Figure 7. Impact of Thpok and LRF on effector Tregs.
(A) Heat map shows expression of select Treg effector genes in dKO, CtrlG and CtrlA cells (Log2 values, color scale at bottom).
(B) Contour plots (left) show CD44 vs. CD62L expression on YFP+ (Cre-expressing) TCRβ+ spleen Tregs from control (top) or dKO (bottom) female Foxp3+/YFP-Cre mice. Bar plots (right) show percentage of CD62L+ or CD62L− CD44hi cells in YFP+ TCRβ+ spleen Tregs in control (open bars), LRF KO (grey bars), Thpok KO (black bars), or dKO (red bars) female Foxp3+/YFP-Cre mice. Data is from at least three animals per genotype and analyzed in at least three independent experiments (control vs. dKO: P<0.01 [**]; other differences not significant).
(C) Cxcr3 expression on CD62L+ (dashed line) or CD62L− CD44hi (solid line) YFP+ cells in female Foxp3+/YFP-Cre control mice. Data is representative of three mice of each genotype analyzed in three independent experiments.
(D) Percentage (left) and absolute number (right) of siLP Foxp3+ TCRβ+ cells in control (open bars), LRF KO (grey bars), Thpok KO (black bars), or dKO (red bars) male mice. Data is from at least three animals per genotype and analyzed in at least three independent experiments.

