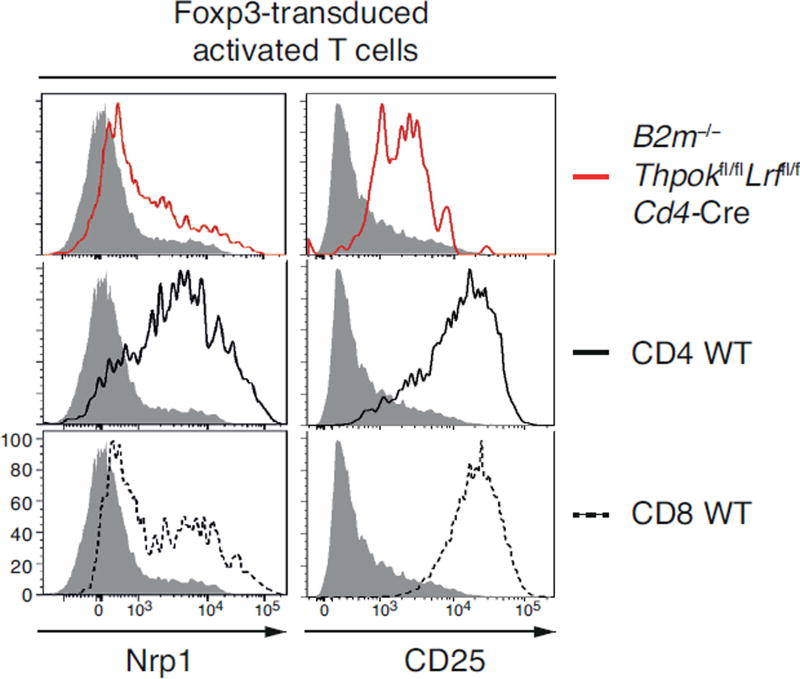
Figure 8. Thpok and LRF support Foxp3-induced gene expression.
Red-line histograms (top plots) show Nrp1 (left) and CD25 (right) expression in Foxp3-transduced MHC II-restricted CD8+ T cells from B2m−/− Thpokfl/fl Lrffl/fl Cd4-Cre mice (in which MHC II-restricted thymocytes differentiate into CD8+ T cells and MHC I-restricted T cells fail to develop). Plain and dashed black-line histograms (middle and bottom plots) show Nrp1 and CD25 expression on Foxp3-transduced wild-type CD4+ and CD8+ T cells. Grey-filled histograms show Nrp1 and CD25 expression on MHC II-restricted CD8+ T cells, from B2m−/− Thpokfl/fl Lrffl/fl Cd4-Cre mice, transduced with an empty retroviral vector. Data is representative of two (Nrp1) or four (CD25) independent experiments.

