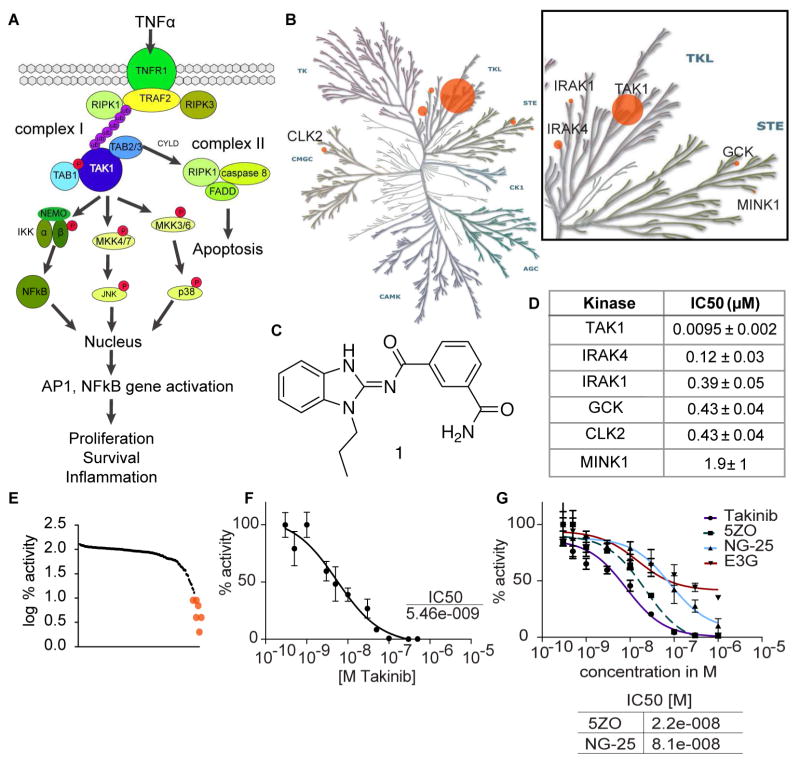
Figure 1.
Identification of Takinib as a potent and selective inhibitor of TAK1. A TNFα pathways indicating TAK1 as a key node for survival signaling B Kinase dendrogram depicting relative potency of top kinase hits. Dots are scaled based on the ratio of IC50 values compared to TAK1. Illustration reproduced courtesy of Cell Signaling Technology, Inc. (www.cellsignal.com). C chemical structure of Takinib D IC50 values as determined by kinase assay at MRC Dundee (n=2, mean ± SEM). E Selectivity profile of Takinib of kinase assay against 140 mammalian kinases performed at MRC Dundee shows log % activity. F Potency of Takinib against TAK1 as determined in kinase assay (shown is a representative experiment of three, n=3, mean ± SEM) G TAK1 inhibitors were directly compared in a kinase assay (n=2, mean ± SEM). Table below shows IC50 values.

