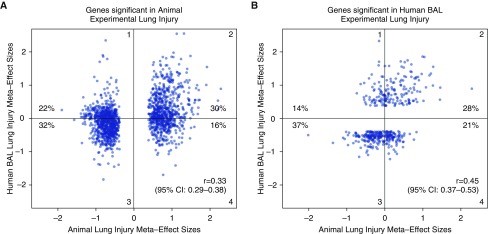
Figure 3.
Unbiased correlations of meta-effect sizes between animal and human experimental lung injury. Different sets of genes are shown in each figure: (A) genes significant in animal experimental lung injury; (B) genes significant in human experimental lung injury. Genes in A may not be significant in human models, and genes significant in B may not be significant in animal models. The percent of genes in each quadrant is shown. Perfect model agreement would be nearly linear, with all genes increased in both human and animal models in quadrant 2, and all genes decreased in both human and animal models in quadrant 3 (e.g., see Figure 1 in the work by Takao and colleagues [8]). Both Pearson r values are highly significant (P < 1E−16). In each graph, the x axis indicates the model type from which genes were selected as significant. CI, confidence interval.

