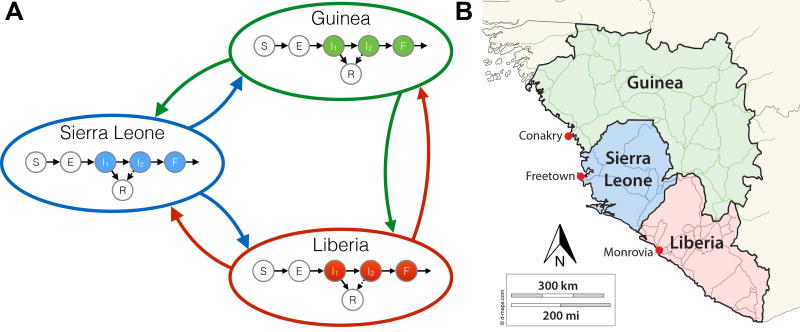
Figure 1.
A diagram of the model structure (left panel) and a map of West Africa showing the locations of each capital used as a population center for each patch (right panel). In each country, the population is compartmentalized into the following categories: susceptible (S), exposed (E), infected in stage one (I1), infected in stage two (I2), died but not yet buried (F), and recovered (R). Transmission is possible from persons in compartments I1, I2, or F of any country, to persons in compartment S, either within the country or to the other countries.

