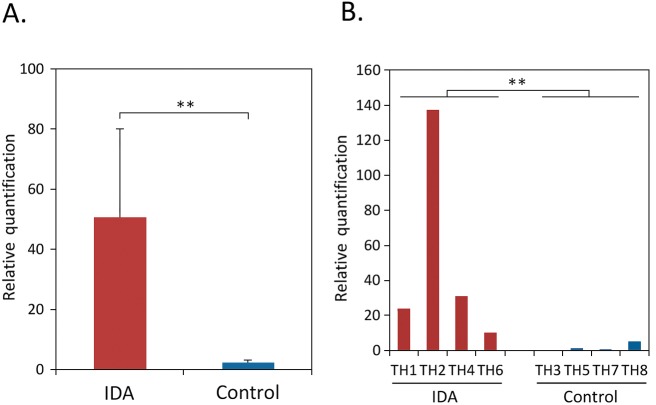
Fig 3. Transcription of sabA gene in IDA or control strains by real-time RT-qPCR.
Panel A: overall expression (relative quantitation) of sabA in the four IDA and four control strains, respectively. Panel B: expression (relative quantitation) of sabA in the eight strains studied each. Expression of sabA was normalized in relation to house-keeping gene gyrA. For relative quantitation, H. pylori TH5 (control) strain was used as control, because expression value of the strain was the least (defined as 1.0). Panel A: results are shown as the Mean ± SE for triplicate determinations. ** p = 0.029, using Wilcoxon rank sum test.

