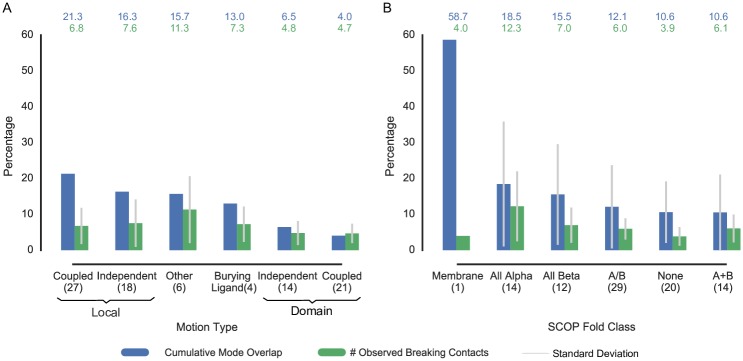
Fig 3. Accuracy improvement of mcENM over ENM in relation to percent of observed breaking contacts on whole data set (90 proteins).
The blue bars depict the absolute accuracy improvement of mcENM over ENM averaged over each group, whereas the green bars show the average amount of removed breaking contacts. The accuracy improvement is calculated by the difference between cumulative mode overlap of the first ten low-frequency modes of mcENM and ENM. (A) Proteins grouped by motion types. (B) Proteins grouped by SCOP fold class.

