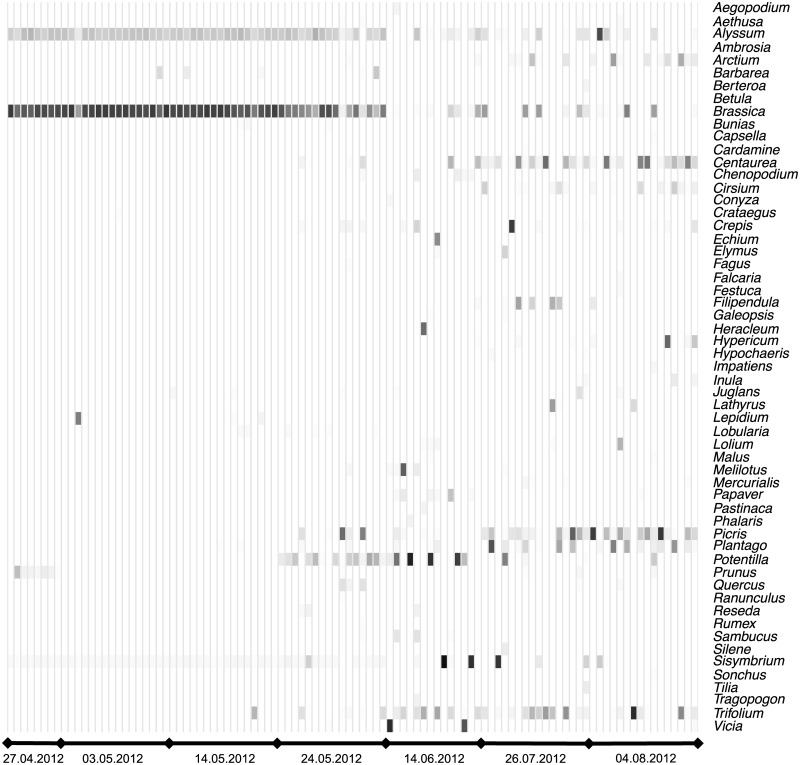
Fig 3. Heatmap of genera composition of pollen samples at seven dates.
Each column presents an individual sample. Each row is a genus that was recorded with relative abundance values above the detection threshold at least within one sample. Darkness intensity of the cells indicate relative abundance of sequence reads within the sample, with white = 0% and black = 100%.

