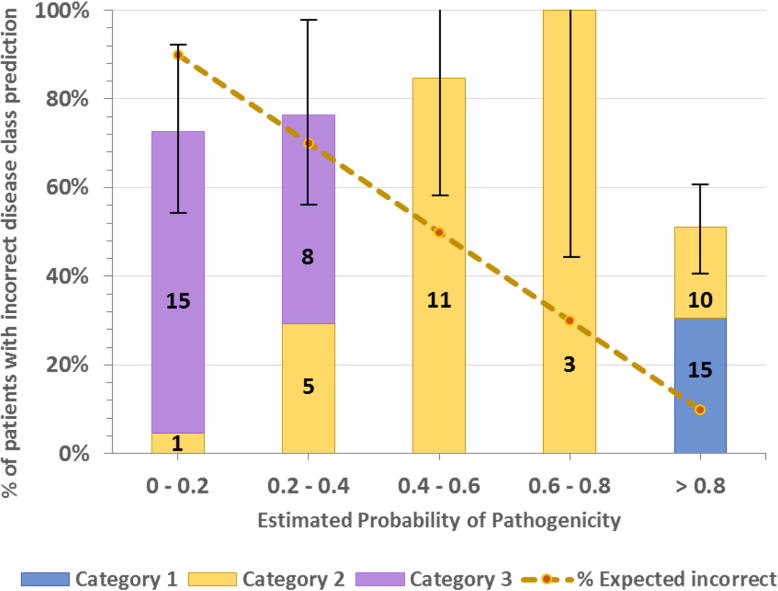
Figure 4.

Distribution of patients with incorrectly assigned disease class versus estimated probability of pathogenicity. The dotted line shows the expected value in each bin (e.g. in the 0.8 to 1.0 bin, 10% of disease assignments are expected to be incorrect). Bars show the % of patients in each bin that actually have incorrect assignments. Bar colors show the number of patients with assignments made in each category (Category 1, most confidence). The error bar for each bin is the standard deviation of the number of patients in that bin. As should be the case for a good probability algorithm, patients with a high probability of a correct disease assignment do have a lower rate of incorrect disease classes. However, the plot also shows that there are 25 patients with high probability scores (> 0.8) but incorrect disease class. 15 of these patients carry variant(s) reported as pathogenic (tagged as DM) in the HGMD database. Reasons for this are discussed in the text.
