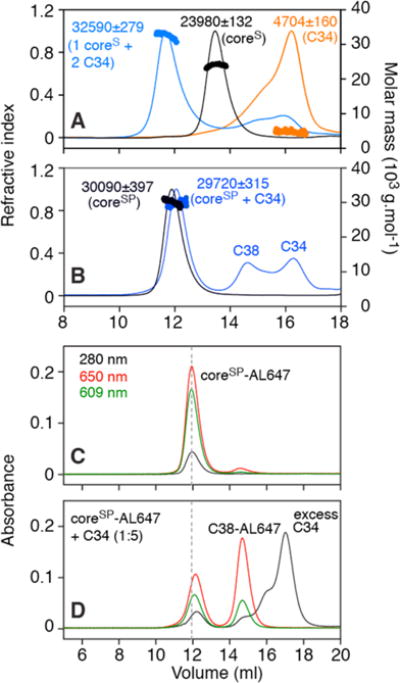
Figure 3.

Size-exclusion chromatography elution profiles and mass analysis under native conditions of coreS, coreSP, and their complexes with C34. (A) SEC–MALS of the coreS trimer in the presence of a 5-fold molar excess of C34 (blue trace). Experimental masses and compositions are indicated beside the peaks. The peak for the complex is consistent with the binding of two C34 molecules to one coreS trimer. Control elution profiles (200 μg/100 μL injection) of coreS and C34 are colored black and orange, respectively. (B) SEC–MALS of coreSP (six-helix bundle assembled with individual N-HR and C-HR peptides) mixed with a 5-fold molar excess of C34 (blue trace). Observed peaks corresponding to C-HR peptide (C38, residues 625–662) and a complex of coreSP with C34 are consistent with displacement of C38 from coreSP by added excess C34. The elution profile and estimated mass of coreSP (control) are colored black. (C) Retention of coreSP labeled with AL647 matches the elution profile of unlabeled coreSP shown in panel B. (D) Displacement of AL647-labeled C38 by added C34 (5-fold molar excess) is consistent with data shown in panel B. Note that the relative extinction coefficients at 609 and 650 nm of AL647 differ depending on the proximity of the dyes to one another (elaborated in the text and Figure S1). Note also that two separate columns were used for SEC–MALS (panels A and B, flow rate of 0.5 mL/min) and absorbance measured at three wavelengths (panels C and D, flow rate of 0.7 mL/min); as a result, the retention volume for free C34 is slightly larger for the latter than the former. Experiments were conducted in 10 mM Tris-HCl (pH 7.6) and 150 mM NaCl.
